 Web Server Statistics for [Protist Information Server]
Program started at Sun-13-Sep-2009 14:34.
Analysed requests from Sat-05-Sep-2009 03:21 to Sat-12-Sep-2009 03:21 (7.00 days).
 Web Server Statistics for [Protist Information Server]
Program started at Sun-13-Sep-2009 14:34.
Analysed requests from Sat-05-Sep-2009 03:21 to Sat-12-Sep-2009 03:21 (7.00 days).
(Go To: Top | General Summary | Monthly Report | Weekly Report | Daily Summary | Hourly Summary | Domain Report | Organisation Report | Host Report | Directory Report | File Type Report)
This report contains overall statistics.
Successful requests: 813,404
Average successful requests per day: 116,200
Successful requests for pages: 290,189
Average successful requests for pages per day: 41,455
Failed requests: 14,689
Redirected requests: 616
Distinct files requested: 307,422
Distinct hosts served: 11,250
Data transferred: 22.83 gigabytes
Average data transferred per day: 3.26 gigabytes
(Go To: Top | General Summary | Monthly Report | Weekly Report | Daily Summary | Hourly Summary | Domain Report | Organisation Report | Host Report | Directory Report | File Type Report)
This report lists the activity in each month.
Each unit ( ) represents 10,000 requests for pages or part thereof.
| month | pages | reqs | Gbytes | |
|---|---|---|---|---|
| Sep 2009 | 290189 | 813404 | 22.83 |     |
Busiest month: Sep 2009 (290,189 requests for pages).
(Go To: Top | General Summary | Monthly Report | Weekly Report | Daily Summary | Hourly Summary | Domain Report | Organisation Report | Host Report | Directory Report | File Type Report)
This report lists the activity in each week.
Each unit ( ) represents 10,000 requests for pages or part thereof.
| week beg. | pages | reqs | Gbytes | |
|---|---|---|---|---|
| 30/Aug/09 | 38528 | 100916 | 3.53 |  |
| 6/Sep/09 | 251661 | 712488 | 19.30 |    |
Busiest week: week beginning 6/Sep/09 (251,661 requests for pages).
(Go To: Top | General Summary | Monthly Report | Weekly Report | Daily Summary | Hourly Summary | Domain Report | Organisation Report | Host Report | Directory Report | File Type Report)
This report lists the total activity for each day of the week, summed over all the weeks in the report.
Each unit ( ) represents 1,500 requests for pages or part thereof.
| day | pages | reqs | Gbytes | |
|---|---|---|---|---|
| Sun | 38345 | 106589 | 3.98 |    |
| Mon | 38918 | 109325 | 2.94 |    |
| Tue | 47740 | 124439 | 2.84 |  |
| Wed | 47540 | 125871 | 2.78 |  |
| Thu | 35224 | 115922 | 3.18 |   |
| Fri | 38965 | 115734 | 3.17 |    |
| Sat | 43457 | 115524 | 3.94 |     |
(Go To: Top | General Summary | Monthly Report | Weekly Report | Daily Summary | Hourly Summary | Domain Report | Organisation Report | Host Report | Directory Report | File Type Report)
This report lists the total activity for each hour of the day, summed over all the days in the report.
Each unit ( ) represents 400 requests for pages or part thereof.
| hour | pages | reqs | Gbytes | |
|---|---|---|---|---|
| 0 | 12124 | 34255 | 0.86 |      |
| 1 | 12738 | 31559 | 0.79 |  |
| 2 | 12444 | 29824 | 0.85 |  |
| 3 | 12151 | 31813 | 0.86 |      |
| 4 | 12195 | 31122 | 0.84 |      |
| 5 | 12204 | 26560 | 0.87 |      |
| 6 | 12355 | 28767 | 0.90 |      |
| 7 | 11613 | 27390 | 0.94 |     |
| 8 | 11952 | 29620 | 0.91 |     |
| 9 | 11336 | 35042 | 1.03 |     |
| 10 | 11691 | 35561 | 1.01 |     |
| 11 | 11603 | 33971 | 1.06 |     |
| 12 | 12599 | 36022 | 1.01 |  |
| 13 | 13753 | 38759 | 0.98 |    |
| 14 | 13764 | 39384 | 1.04 |    |
| 15 | 12626 | 37619 | 1.04 |  |
| 16 | 12612 | 39957 | 1.09 |  |
| 17 | 11511 | 37138 | 1.06 |     |
| 18 | 11247 | 34200 | 1.02 |     |
| 19 | 11075 | 32932 | 0.97 |    |
| 20 | 11449 | 36055 | 0.91 |     |
| 21 | 11794 | 35700 | 0.96 |     |
| 22 | 11902 | 36076 | 0.86 |     |
| 23 | 11451 | 34078 | 0.95 |     |
(Go To: Top | General Summary | Monthly Report | Weekly Report | Daily Summary | Hourly Summary | Domain Report | Organisation Report | Host Report | Directory Report | File Type Report)
This report lists the countries of the computers which requested files.
Listing domains, sorted by the amount of traffic.
| pages | %pages | reqs | %reqs | Gbytes | %bytes | domain |
|---|---|---|---|---|---|---|
| 290189 | 100% | 813404 | 100% | 22.83 | 100% | [unresolved numerical addresses] |
(Go To: Top | General Summary | Monthly Report | Weekly Report | Daily Summary | Hourly Summary | Domain Report | Organisation Report | Host Report | Directory Report | File Type Report)
This report lists the organisations of the computers which requested files.

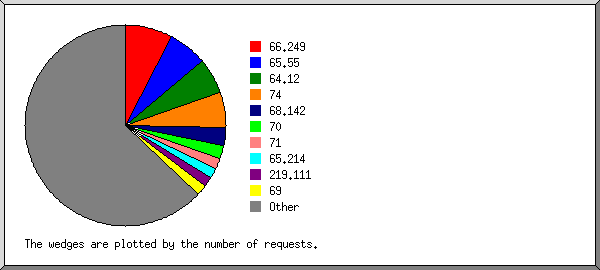
Listing the top 20 organisations by the number of requests, sorted by the number of requests.
| pages | %pages | reqs | %reqs | Gbytes | %bytes | organisation |
|---|---|---|---|---|---|---|
| 37632 | 12.97% | 164730 | 20.25% | 13.59 | 59.53% | 74 |
| 55670 | 19.18% | 96413 | 11.85% | 0.73 | 3.18% | 66.249 |
| 60950 | 21.00% | 67230 | 8.27% | 0.33 | 1.46% | 65.55 |
| 22382 | 7.71% | 35220 | 4.33% | 4.40 | 19.28% | 202.131 |
| 22132 | 7.63% | 25460 | 3.13% | 0.10 | 0.44% | 72 |
| 14386 | 4.96% | 15059 | 1.85% | 0.04 | 0.17% | 67.195 |
| 1356 | 0.47% | 14070 | 1.73% | 0.13 | 0.55% | 124 |
| 12248 | 4.22% | 12559 | 1.54% | 0.01 | 0.03% | 217.212 |
| 150 | 0.05% | 11609 | 1.43% | 0.02 | 0.09% | 220.181 |
| 5166 | 1.78% | 10805 | 1.33% | 0.09 | 0.41% | 119 |
| 10254 | 3.53% | 10267 | 1.26% | 0.03 | 0.13% | 67.218 |
| 2096 | 0.72% | 9955 | 1.22% | 0.10 | 0.43% | 121 |
| 813 | 0.28% | 9551 | 1.17% | 0.09 | 0.41% | 114 |
| 691 | 0.24% | 9342 | 1.15% | 0.10 | 0.45% | 125 |
| 646 | 0.22% | 9009 | 1.11% | 0.12 | 0.54% | 118 |
| 8555 | 2.95% | 8563 | 1.05% | 0.01 | 0.05% | 67.110 |
| 1037 | 0.36% | 7167 | 0.88% | 0.05 | 0.22% | 133.5 |
| 496 | 0.17% | 6783 | 0.83% | 0.08 | 0.35% | 122 |
| 571 | 0.20% | 5438 | 0.67% | 0.06 | 0.27% | 123 |
| 5138 | 1.77% | 5170 | 0.64% | 0.01 | 0.06% | 208.115 |
| 27820 | 9.59% | 279004 | 34.30% | 2.73 | 11.97% | [not listed: 2,693 organisations] |
(Go To: Top | General Summary | Monthly Report | Weekly Report | Daily Summary | Hourly Summary | Domain Report | Organisation Report | Host Report | Directory Report | File Type Report)
This report lists the computers which requested files.

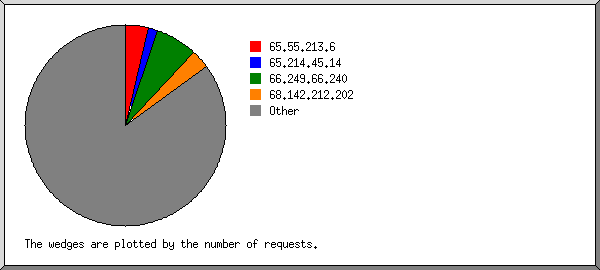
Listing hosts with at least 1000 requests, sorted alphabetically.
| pages | %pages | reqs | %reqs | Gbytes | %bytes | host |
|---|---|---|---|---|---|---|
| 133 | 0.05% | 1091 | 0.13% | 0.05 | 0.22% | 59.138.0.107 |
| 1357 | 0.47% | 1369 | 0.17% | 0.00 | 65.55.210.207 | |
| 3697 | 1.27% | 4435 | 0.55% | 0.09 | 0.39% | 66.249.67.44 |
| 12510 | 4.31% | 14514 | 1.78% | 0.26 | 1.15% | 66.249.68.140 |
| 39398 | 13.58% | 77363 | 9.51% | 0.37 | 1.63% | 66.249.68.217 |
| 8555 | 2.95% | 8563 | 1.05% | 0.01 | 0.05% | 67.110.143.50 |
| 14208 | 4.90% | 14787 | 1.82% | 0.04 | 0.17% | 67.195.115.56 |
| 3020 | 1.04% | 3026 | 0.37% | 0.00 | 0.02% | 67.218.116.162 |
| 7234 | 2.49% | 7241 | 0.89% | 0.02 | 0.11% | 67.218.116.163 |
| 186 | 0.06% | 1647 | 0.20% | 0.01 | 0.04% | 71.31.158.83 |
| 2312 | 0.80% | 2367 | 0.29% | 0.01 | 0.03% | 72.30.142.169 |
| 19577 | 6.75% | 20173 | 2.48% | 0.06 | 0.28% | 72.30.161.249 |
| 15193 | 5.24% | 15611 | 1.92% | 0.05 | 0.21% | 74.6.18.245 |
| 21927 | 7.56% | 25193 | 3.10% | 0.08 | 0.33% | 74.6.22.166 |
| 1 | 119460 | 14.69% | 13.43 | 58.83% | 74.6.149.143 | |
| 190 | 0.07% | 3052 | 0.38% | 0.03 | 0.13% | 74.125.74.193 |
| 146 | 0.05% | 1634 | 0.20% | 0.01 | 0.05% | 78.146.106.226 |
| 158 | 0.05% | 1779 | 0.22% | 0.01 | 0.04% | 96.56.40.18 |
| 150 | 0.05% | 1281 | 0.16% | 0.01 | 0.03% | 114.169.222.9 |
| 107 | 0.04% | 1481 | 0.18% | 0.01 | 0.03% | 114.182.132.41 |
| 71 | 0.02% | 1358 | 0.17% | 0.02 | 0.10% | 116.82.203.155 |
| 3813 | 1.31% | 3817 | 0.47% | 0.01 | 0.03% | 119.63.195.28 |
| 1712 | 0.59% | 4091 | 0.50% | 0.03 | 0.13% | 121.3.38.36 |
| 271 | 0.09% | 3705 | 0.46% | 0.01 | 0.05% | 124.121.200.18 |
| 996 | 0.34% | 6968 | 0.86% | 0.05 | 0.22% | 133.5.203.5 |
| 181 | 0.06% | 2331 | 0.29% | 0.04 | 0.16% | 133.25.19.153 |
| 133 | 0.05% | 1120 | 0.14% | 0.01 | 0.03% | 158.210.70.119 |
| 217 | 0.07% | 1384 | 0.17% | 0.01 | 0.05% | 192.244.210.205 |
| 181 | 0.06% | 3011 | 0.37% | 0.01 | 0.06% | 198.243.1.3 |
| 123 | 0.04% | 1474 | 0.18% | 0.01 | 0.03% | 200.205.187.134 |
| 108 | 0.04% | 1456 | 0.18% | 0.01 | 0.03% | 201.244.169.39 |
| 4388 | 1.51% | 6934 | 0.85% | 0.88 | 3.85% | 202.131.30.146 |
| 4555 | 1.57% | 7069 | 0.87% | 0.88 | 3.84% | 202.131.30.147 |
| 4480 | 1.54% | 7018 | 0.86% | 0.88 | 3.86% | 202.131.30.148 |
| 4451 | 1.53% | 6997 | 0.86% | 0.88 | 3.84% | 202.131.30.149 |
| 4481 | 1.54% | 6988 | 0.86% | 0.88 | 3.87% | 202.131.30.150 |
| 5138 | 1.77% | 5170 | 0.64% | 0.01 | 0.06% | 208.115.111.245 |
| 98 | 0.03% | 3199 | 0.39% | 0.04 | 0.16% | 211.1.219.171 |
| 12248 | 4.22% | 12290 | 1.51% | 0.01 | 0.03% | 217.212.224.181 |
| 53 | 0.02% | 1129 | 0.14% | 0.01 | 0.06% | 220.55.22.92 |
| 0 | 2251 | 0.28% | 0.00 | 0.01% | 220.181.37.84 | |
| 0 | 2284 | 0.28% | 0.00 | 0.01% | 220.181.38.44 | |
| 0 | 2340 | 0.29% | 0.00 | 0.01% | 220.181.38.48 | |
| 0 | 2289 | 0.28% | 0.00 | 0.01% | 220.181.43.11 | |
| 0 | 2211 | 0.27% | 0.00 | 0.02% | 220.181.44.13 | |
| 61 | 0.02% | 1008 | 0.12% | 0.02 | 0.08% | 220.214.31.162 |
| 92371 | 31.83% | 387445 | 47.63% | 3.58 | 15.66% | [not listed: 11,204 hosts] |
(Go To: Top | General Summary | Monthly Report | Weekly Report | Daily Summary | Hourly Summary | Domain Report | Organisation Report | Host Report | Directory Report | File Type Report)
This report lists the directories from which files were requested. (The figures for each directory include all of its subdirectories.)

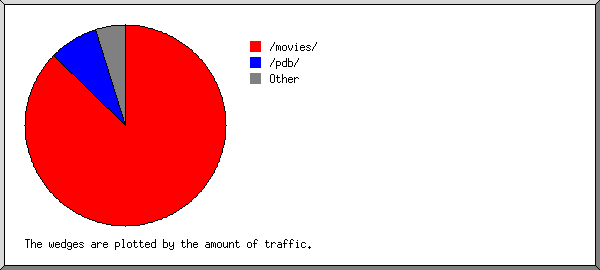
Listing directories with at least 0.01% of the traffic, sorted by the amount of traffic.
| pages | %pages | reqs | %reqs | Gbytes | %bytes | directory |
|---|---|---|---|---|---|---|
| 170718 | 58.83% | 401025 | 49.30% | 8.47 | 37.08% | /pdb/ |
| 10432 | 3.59% | 40818 | 5.02% | 2.79 | 12.24% | /pdb6/ |
| 10587 | 3.65% | 40037 | 4.92% | 2.35 | 10.29% | /pdb4/ |
| 9254 | 3.19% | 37946 | 4.67% | 2.34 | 10.23% | /pdb5/ |
| 8609 | 2.97% | 34872 | 4.29% | 1.89 | 8.26% | /pdb7/ |
| 11618 | 4.00% | 46200 | 5.68% | 1.47 | 6.44% | /pdb3/ |
| 14120 | 4.87% | 51962 | 6.39% | 1.34 | 5.87% | /pdb2/ |
| 7337 | 2.53% | 18218 | 2.24% | 1.03 | 4.49% | /pdb8/ |
| 14839 | 5.11% | 36927 | 4.54% | 0.33 | 1.46% | /movies/ |
| 3562 | 1.23% | 7285 | 0.90% | 0.33 | 1.46% | /pdb9/ |
| 6624 | 2.28% | 15492 | 1.90% | 0.19 | 0.81% | /asagao/ |
| 13100 | 4.51% | 15808 | 1.94% | 0.14 | 0.62% | /taxonomy/ |
| 1428 | 0.49% | 2313 | 0.28% | 0.04 | 0.17% | /gbif/ |
| 2286 | 0.79% | 4999 | 0.61% | 0.04 | 0.17% | /virus/ |
| 20 | 0.01% | 20642 | 2.54% | 0.02 | 0.10% | /gifs/ |
| 1732 | 0.60% | 2111 | 0.26% | 0.01 | 0.06% | /protistology/ |
| 1333 | 0.46% | 3734 | 0.46% | 0.01 | 0.05% | [root directory] |
| 1430 | 0.49% | 1807 | 0.22% | 0.01 | 0.05% | /science_internet/ |
| 0 | 19530 | 2.40% | 0.01 | 0.04% | /stylesheets/ | |
| 638 | 0.22% | 679 | 0.08% | 0.01 | 0.04% | /protistinfo/ |
| 6 | 12 | 0.01 | 0.03% | /ftp/ | ||
| 516 | 0.18% | 10987 | 1.35% | 0.01 | 0.03% | [not listed: 10 directories] |
(Go To: Top | General Summary | Monthly Report | Weekly Report | Daily Summary | Hourly Summary | Domain Report | Organisation Report | Host Report | Directory Report | File Type Report)
This report lists the extensions of files.

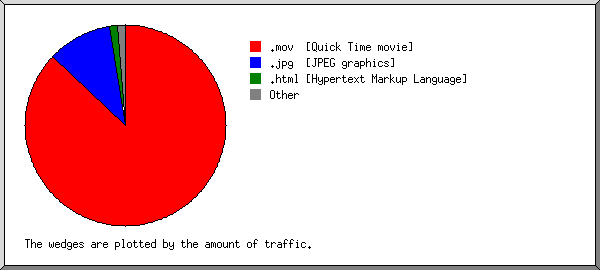
Listing extensions with at least 0.1% of the traffic, sorted by the amount of traffic.
| reqs | %reqs | Gbytes | %bytes | extension |
|---|---|---|---|---|
| 454444 | 55.87% | 21.69 | 95.01% | .jpg [JPEG graphics] |
| 246324 | 30.28% | 0.54 | 2.36% | .html [Hypertext Markup Language] |
| 15658 | 1.92% | 0.27 | 1.19% | .mov [Quick Time movie] |
| 43745 | 5.38% | 0.24 | 1.07% | [directories] |
| 20582 | 2.53% | 0.06 | 0.26% | .gif [GIF graphics] |
| 32651 | 4.01% | 0.02 | 0.10% | [not listed: 50 extensions] |