 Web Server Statistics for [Protist Information Server]
Program started at Tue-16-Jun-2009 13:04.
Analysed requests from Sat-06-Jun-2009 03:21 to Sat-13-Jun-2009 03:21 (7.00 days).
 Web Server Statistics for [Protist Information Server]
Program started at Tue-16-Jun-2009 13:04.
Analysed requests from Sat-06-Jun-2009 03:21 to Sat-13-Jun-2009 03:21 (7.00 days).
(Go To: Top | General Summary | Monthly Report | Weekly Report | Daily Summary | Hourly Summary | Domain Report | Organisation Report | Host Report | Directory Report | File Type Report)
This report contains overall statistics.
Successful requests: 648,786
Average successful requests per day: 92,683
Successful requests for pages: 220,537
Average successful requests for pages per day: 31,505
Failed requests: 12,111
Redirected requests: 342
Distinct files requested: 197,336
Distinct hosts served: 11,937
Data transferred: 11.28 gigabytes
Average data transferred per day: 1.61 gigabytes
(Go To: Top | General Summary | Monthly Report | Weekly Report | Daily Summary | Hourly Summary | Domain Report | Organisation Report | Host Report | Directory Report | File Type Report)
This report lists the activity in each month.
Each unit ( ) represents 8,000 requests for pages or part thereof.
| month | pages | reqs | Gbytes | |
|---|---|---|---|---|
| Jun 2009 | 220537 | 648786 | 11.28 |    |
Busiest month: Jun 2009 (220,537 requests for pages).
(Go To: Top | General Summary | Monthly Report | Weekly Report | Daily Summary | Hourly Summary | Domain Report | Organisation Report | Host Report | Directory Report | File Type Report)
This report lists the activity in each week.
Each unit ( ) represents 8,000 requests for pages or part thereof.
| week beg. | pages | reqs | Gbytes | |
|---|---|---|---|---|
| 31/May/09 | 26053 | 73322 | 1.18 |  |
| 7/Jun/09 | 194484 | 575464 | 10.09 |    |
Busiest week: week beginning 7/Jun/09 (194,484 requests for pages).
(Go To: Top | General Summary | Monthly Report | Weekly Report | Daily Summary | Hourly Summary | Domain Report | Organisation Report | Host Report | Directory Report | File Type Report)
This report lists the total activity for each day of the week, summed over all the weeks in the report.
Each unit ( ) represents 1,000 requests for pages or part thereof.
| day | pages | reqs | Gbytes | |
|---|---|---|---|---|
| Sun | 32638 | 84476 | 1.57 |   |
| Mon | 36105 | 99392 | 2.04 |    |
| Tue | 35453 | 103422 | 2.09 |   |
| Wed | 27357 | 91160 | 1.40 |    |
| Thu | 29410 | 92571 | 1.27 |     |
| Fri | 28831 | 92670 | 1.50 |     |
| Sat | 30743 | 85095 | 1.40 |      |
(Go To: Top | General Summary | Monthly Report | Weekly Report | Daily Summary | Hourly Summary | Domain Report | Organisation Report | Host Report | Directory Report | File Type Report)
This report lists the total activity for each hour of the day, summed over all the days in the report.
Each unit ( ) represents 300 requests for pages or part thereof.
| hour | pages | reqs | Mbytes | |
|---|---|---|---|---|
| 0 | 9618 | 26082 | 546.33 |   |
| 1 | 9436 | 25552 | 452.68 |  |
| 2 | 8825 | 21878 | 441.82 |     |
| 3 | 9190 | 19317 | 403.88 |      |
| 4 | 9098 | 18234 | 327.19 |      |
| 5 | 8382 | 18824 | 389.90 |    |
| 6 | 8482 | 18752 | 289.02 |     |
| 7 | 7470 | 18163 | 297.79 |    |
| 8 | 8249 | 21949 | 399.67 |    |
| 9 | 8365 | 25613 | 503.17 |    |
| 10 | 8997 | 29660 | 559.54 |     |
| 11 | 10042 | 29652 | 444.09 |   |
| 12 | 10595 | 34070 | 551.26 |   |
| 13 | 9290 | 29221 | 552.71 |      |
| 14 | 9128 | 28979 | 550.52 |      |
| 15 | 8909 | 29352 | 491.49 |     |
| 16 | 9329 | 31582 | 506.16 |  |
| 17 | 9587 | 32404 | 485.27 |  |
| 18 | 8936 | 30392 | 497.14 |     |
| 19 | 8796 | 28230 | 540.45 |     |
| 20 | 9585 | 31072 | 498.55 |  |
| 21 | 9833 | 33105 | 627.70 |   |
| 22 | 10053 | 32012 | 590.78 |   |
| 23 | 10342 | 34691 | 599.10 |    |
(Go To: Top | General Summary | Monthly Report | Weekly Report | Daily Summary | Hourly Summary | Domain Report | Organisation Report | Host Report | Directory Report | File Type Report)
This report lists the countries of the computers which requested files.
Listing domains, sorted by the amount of traffic.
| pages | %pages | reqs | %reqs | Gbytes | %bytes | domain |
|---|---|---|---|---|---|---|
| 220537 | 100% | 648786 | 100% | 11.28 | 100% | [unresolved numerical addresses] |
(Go To: Top | General Summary | Monthly Report | Weekly Report | Daily Summary | Hourly Summary | Domain Report | Organisation Report | Host Report | Directory Report | File Type Report)
This report lists the organisations of the computers which requested files.

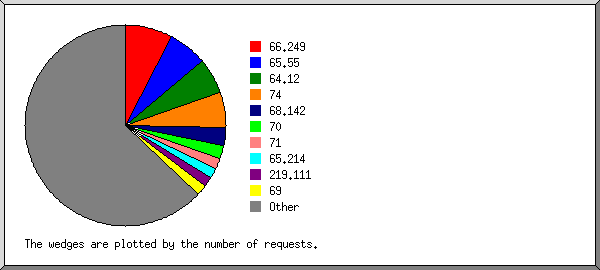
Listing the top 20 organisations by the number of requests, sorted by the number of requests.
| pages | %pages | reqs | %reqs | Gbytes | %bytes | organisation |
|---|---|---|---|---|---|---|
| 73430 | 33.30% | 107706 | 16.60% | 0.42 | 3.70% | 66.249 |
| 34518 | 15.65% | 38729 | 5.97% | 0.14 | 1.25% | 74 |
| 25834 | 11.71% | 30533 | 4.71% | 0.68 | 6.05% | 65.55 |
| 10935 | 4.96% | 25833 | 3.98% | 5.44 | 48.25% | 61.247 |
| 627 | 0.28% | 14971 | 2.31% | 0.12 | 1.06% | 121 |
| 1054 | 0.48% | 14446 | 2.23% | 0.12 | 1.07% | 125 |
| 11110 | 5.04% | 13636 | 2.10% | 0.06 | 0.54% | 72 |
| 1787 | 0.81% | 13301 | 2.05% | 0.23 | 2.01% | 122 |
| 8096 | 3.67% | 12264 | 1.89% | 0.09 | 0.78% | 119 |
| 172 | 0.08% | 11439 | 1.76% | 0.02 | 0.16% | 220.181 |
| 965 | 0.44% | 10517 | 1.62% | 0.12 | 1.05% | 114 |
| 1018 | 0.46% | 9897 | 1.53% | 0.11 | 0.95% | 124 |
| 718 | 0.33% | 8505 | 1.31% | 0.11 | 0.95% | 118 |
| 928 | 0.42% | 7301 | 1.13% | 0.16 | 1.40% | 61.242 |
| 1009 | 0.46% | 7201 | 1.11% | 0.07 | 0.60% | 83 |
| 6722 | 3.05% | 6729 | 1.04% | 0.02 | 0.15% | 67.110 |
| 1 | 6676 | 1.03% | 0.06 | 0.57% | 64.88 | |
| 855 | 0.39% | 6479 | 1.00% | 0.07 | 0.60% | 123 |
| 416 | 0.19% | 5941 | 0.92% | 0.06 | 0.55% | 58 |
| 453 | 0.21% | 5773 | 0.89% | 0.06 | 0.56% | 60 |
| 39889 | 18.09% | 290909 | 44.84% | 3.13 | 27.74% | [not listed: 2,629 organisations] |
(Go To: Top | General Summary | Monthly Report | Weekly Report | Daily Summary | Hourly Summary | Domain Report | Organisation Report | Host Report | Directory Report | File Type Report)
This report lists the computers which requested files.

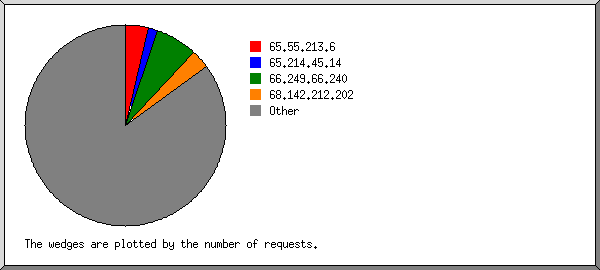
Listing hosts with at least 1000 requests, sorted alphabetically.
| pages | %pages | reqs | %reqs | Gbytes | %bytes | host |
|---|---|---|---|---|---|---|
| 0 | 2792 | 0.43% | 0.05 | 0.47% | 38.99.13.117 | |
| 136 | 0.06% | 1301 | 0.20% | 0.01 | 0.06% | 41.196.50.189 |
| 928 | 0.42% | 7301 | 1.13% | 0.16 | 1.40% | 61.242.102.69 |
| 1998 | 0.91% | 4335 | 0.67% | 1.01 | 8.96% | 61.247.222.44 |
| 2309 | 1.05% | 4863 | 0.75% | 1.20 | 10.62% | 61.247.222.45 |
| 2282 | 1.03% | 4687 | 0.72% | 1.10 | 9.74% | 61.247.222.54 |
| 2307 | 1.05% | 4755 | 0.73% | 1.10 | 9.75% | 61.247.222.55 |
| 2031 | 0.92% | 4379 | 0.67% | 1.03 | 9.17% | 61.247.222.56 |
| 152 | 0.07% | 1178 | 0.18% | 0.01 | 0.09% | 63.250.143.9 |
| 1 | 6676 | 1.03% | 0.06 | 0.57% | 64.88.164.198 | |
| 1546 | 0.70% | 1556 | 0.24% | 0.00 | 0.01% | 65.55.210.203 |
| 1066 | 0.48% | 1080 | 0.17% | 0.00 | 65.55.210.204 | |
| 1195 | 0.54% | 1207 | 0.19% | 0.00 | 0.01% | 65.55.210.205 |
| 1982 | 0.90% | 1992 | 0.31% | 0.00 | 0.01% | 65.55.210.206 |
| 2269 | 1.03% | 2279 | 0.35% | 0.00 | 0.01% | 65.55.210.207 |
| 1082 | 0.49% | 1097 | 0.17% | 0.00 | 65.55.210.209 | |
| 1273 | 0.58% | 1283 | 0.20% | 0.00 | 65.55.210.220 | |
| 1244 | 0.56% | 1255 | 0.19% | 0.00 | 65.55.210.221 | |
| 44 | 0.02% | 1043 | 0.16% | 0.00 | 0.04% | 66.235.124.132 |
| 9362 | 4.25% | 10021 | 1.54% | 0.03 | 0.26% | 66.249.68.9 |
| 1267 | 0.57% | 1328 | 0.20% | 0.00 | 0.03% | 66.249.68.47 |
| 2361 | 1.07% | 2853 | 0.44% | 0.01 | 0.08% | 66.249.68.82 |
| 3377 | 1.53% | 3760 | 0.58% | 0.01 | 0.10% | 66.249.68.85 |
| 8017 | 3.64% | 9336 | 1.44% | 0.06 | 0.53% | 66.249.68.144 |
| 18715 | 8.49% | 28914 | 4.46% | 0.06 | 0.57% | 66.249.68.179 |
| 267 | 0.12% | 1612 | 0.25% | 0.00 | 0.04% | 66.249.68.182 |
| 21571 | 9.78% | 37868 | 5.84% | 0.09 | 0.84% | 66.249.68.199 |
| 8228 | 3.73% | 10333 | 1.59% | 0.12 | 1.10% | 66.249.68.217 |
| 152 | 0.07% | 1492 | 0.23% | 0.02 | 0.16% | 66.249.85.129 |
| 6722 | 3.05% | 6729 | 1.04% | 0.02 | 0.15% | 67.110.143.50 |
| 192 | 0.09% | 3112 | 0.48% | 0.01 | 0.12% | 71.188.137.107 |
| 10648 | 4.83% | 11203 | 1.73% | 0.04 | 0.31% | 72.30.87.105 |
| 33996 | 15.42% | 35176 | 5.42% | 0.11 | 0.95% | 74.6.18.242 |
| 258 | 0.12% | 2764 | 0.43% | 0.03 | 0.26% | 74.125.74.212 |
| 110 | 0.05% | 1389 | 0.21% | 0.02 | 0.17% | 78.20.109.70 |
| 854 | 0.39% | 5865 | 0.90% | 0.05 | 0.47% | 83.149.247.130 |
| 181 | 0.08% | 1138 | 0.18% | 0.01 | 0.11% | 89.172.245.109 |
| 222 | 0.10% | 1541 | 0.24% | 0.01 | 0.12% | 96.51.200.39 |
| 261 | 0.12% | 2466 | 0.38% | 0.01 | 0.13% | 114.159.40.223 |
| 2005 | 0.91% | 2006 | 0.31% | 0.01 | 0.07% | 119.63.194.112 |
| 5559 | 2.52% | 5720 | 0.88% | 0.02 | 0.18% | 119.63.195.28 |
| 0 | 6666 | 1.03% | 0.02 | 0.19% | 121.14.89.166 | |
| 384 | 0.17% | 3978 | 0.61% | 0.14 | 1.21% | 122.217.216.203 |
| 200 | 0.09% | 3302 | 0.51% | 0.05 | 0.42% | 133.25.19.153 |
| 283 | 0.13% | 1146 | 0.18% | 0.08 | 0.67% | 149.169.130.127 |
| 278 | 0.13% | 2041 | 0.31% | 0.02 | 0.16% | 149.169.145.26 |
| 193 | 0.09% | 1438 | 0.22% | 0.01 | 0.10% | 193.198.74.134 |
| 143 | 0.06% | 1313 | 0.20% | 0.01 | 0.10% | 198.99.76.2 |
| 51 | 0.02% | 1023 | 0.16% | 0.02 | 0.14% | 202.3.147.210 |
| 250 | 0.11% | 2371 | 0.37% | 0.01 | 0.13% | 202.101.92.11 |
| 2658 | 1.21% | 3512 | 0.54% | 0.30 | 2.67% | 202.238.75.127 |
| 3524 | 1.60% | 3577 | 0.55% | 0.01 | 0.12% | 208.115.111.245 |
| 227 | 0.10% | 2733 | 0.42% | 0.01 | 0.12% | 210.218.66.4 |
| 30 | 0.01% | 1346 | 0.21% | 0.01 | 0.06% | 210.236.86.1 |
| 0 | 5560 | 0.86% | 0.01 | 0.07% | 220.181.5.143 | |
| 0 | 5697 | 0.88% | 0.01 | 0.07% | 220.181.5.144 | |
| 137 | 0.06% | 2009 | 0.31% | 0.01 | 0.08% | 221.188.44.133 |
| 98 | 0.04% | 1551 | 0.24% | 0.01 | 0.07% | 221.224.126.98 |
| 168 | 0.08% | 2110 | 0.33% | 0.06 | 0.53% | 222.1.147.104 |
| 151 | 0.07% | 1261 | 0.19% | 0.04 | 0.32% | 222.158.222.22 |
| 53592 | 24.30% | 354467 | 54.64% | 3.96 | 35.14% | [not listed: 11,877 hosts] |
(Go To: Top | General Summary | Monthly Report | Weekly Report | Daily Summary | Hourly Summary | Domain Report | Organisation Report | Host Report | Directory Report | File Type Report)
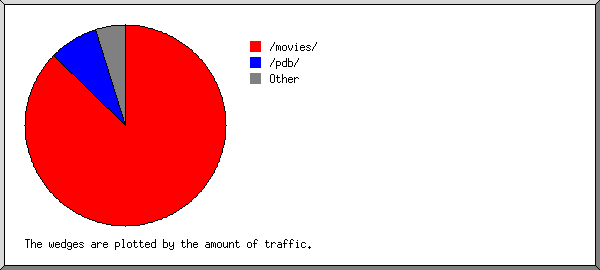
This report lists the directories from which files were requested. (The figures for each directory include all of its subdirectories.)

Listing directories with at least 0.01% of the traffic, sorted by the amount of traffic.
| pages | %pages | reqs | %reqs | Gbytes | %bytes | directory |
|---|---|---|---|---|---|---|
| 128715 | 58.36% | 356187 | 54.90% | 8.97 | 79.59% | /pdb/ |
| 9603 | 4.35% | 33759 | 5.20% | 0.80 | 7.09% | /movies/ |
| 8355 | 3.79% | 22344 | 3.44% | 0.18 | 1.62% | /pdb6/ |
| 12405 | 5.62% | 35958 | 5.54% | 0.16 | 1.43% | /pdb2/ |
| 8268 | 3.75% | 22997 | 3.54% | 0.16 | 1.41% | /pdb4/ |
| 7101 | 3.22% | 20863 | 3.22% | 0.16 | 1.40% | /pdb5/ |
| 4785 | 2.17% | 11957 | 1.84% | 0.16 | 1.39% | /asagao/ |
| 9216 | 4.18% | 27731 | 4.27% | 0.13 | 1.18% | /pdb3/ |
| 7909 | 3.59% | 10594 | 1.63% | 0.12 | 1.06% | /taxonomy/ |
| 7410 | 3.36% | 18604 | 2.87% | 0.12 | 1.03% | /pdb7/ |
| 6048 | 2.74% | 12243 | 1.89% | 0.10 | 0.89% | /pdb8/ |
| 2874 | 1.30% | 5818 | 0.90% | 0.05 | 0.48% | /virus/ |
| 1342 | 0.61% | 2525 | 0.39% | 0.05 | 0.40% | /gbif/ |
| 18 | 0.01% | 23049 | 3.55% | 0.03 | 0.24% | /gifs/ |
| 1035 | 0.47% | 2208 | 0.34% | 0.02 | 0.18% | /pdb9/ |
| 1674 | 0.76% | 5354 | 0.83% | 0.02 | 0.15% | [root directory] |
| 1430 | 0.65% | 1721 | 0.27% | 0.01 | 0.09% | /protistology/ |
| 1190 | 0.54% | 1436 | 0.22% | 0.01 | 0.08% | /science_internet/ |
| 0 | 21273 | 3.28% | 0.01 | 0.08% | /stylesheets/ | |
| 10 | 20 | 0.01 | 0.07% | /ftp/ | ||
| 551 | 0.25% | 559 | 0.09% | 0.01 | 0.05% | /protistinfo/ |
| 7 | 510 | 0.08% | 0.00 | 0.03% | /bgcolors/ | |
| 139 | 0.06% | 139 | 0.02% | 0.00 | 0.03% | /servers/ |
| 204 | 0.09% | 344 | 0.05% | 0.00 | 0.02% | /evolution/ |
| 248 | 0.11% | 10593 | 1.63% | 0.00 | 0.01% | [not listed: 7 directories] |
(Go To: Top | General Summary | Monthly Report | Weekly Report | Daily Summary | Hourly Summary | Domain Report | Organisation Report | Host Report | Directory Report | File Type Report)
This report lists the extensions of files.

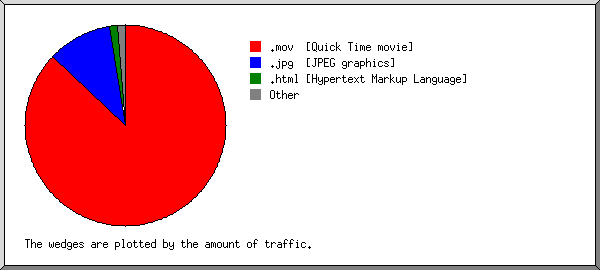
Listing extensions with at least 0.1% of the traffic, sorted by the amount of traffic.
| reqs | %reqs | Gbytes | %bytes | extension |
|---|---|---|---|---|
| 351748 | 54.22% | 9.78 | 86.72% | .jpg [JPEG graphics] |
| 20368 | 3.14% | 0.73 | 6.46% | .mov [Quick Time movie] |
| 186071 | 28.68% | 0.48 | 4.28% | .html [Hypertext Markup Language] |
| 34348 | 5.29% | 0.20 | 1.79% | [directories] |
| 20328 | 3.13% | 0.05 | 0.43% | .gif [GIF graphics] |
| 3 | 0.01 | 0.10% | .mp4 | |
| 35920 | 5.54% | 0.03 | 0.23% | [not listed: 33 extensions] |