 Web Server Statistics for [Protist Information Server]
Program started at Sat-26-Jul-2008 12:31.
Analysed requests from Sat-05-Jul-2008 03:20 to Sat-12-Jul-2008 03:20 (7.00 days).
Web Server Statistics for [Protist Information Server]Program started at Sat-26-Jul-2008 12:31.
Analysed requests from Sat-05-Jul-2008 03:20 to Sat-12-Jul-2008 03:20 (7.00 days).
(Go To: Top | General Summary | Monthly Report | Weekly Report | Daily Summary | Hourly Summary | Domain Report | Organisation Report | Host Report | Directory Report | File Type Report)
This report contains overall statistics.
Successful requests: 768,204
Average successful requests per day: 109,743
Successful requests for pages: 304,418
Average successful requests for pages per day: 43,488
Failed requests: 11,700
Redirected requests: 761
Distinct files requested: 191,079
Distinct hosts served: 11,353
Data transferred: 16.45 gigabytes
Average data transferred per day: 2.35 gigabytes
(Go To: Top | General Summary | Monthly Report | Weekly Report | Daily Summary | Hourly Summary | Domain Report | Organisation Report | Host Report | Directory Report | File Type Report)
This report lists the activity in each month.
Each unit ( ) represents 10,000 requests for pages or part thereof.
| month | pages | reqs | Gbytes | |
|---|---|---|---|---|
| Jul 2008 | 304418 | 768204 | 16.45 |     |
Busiest month: Jul 2008 (304,418 requests for pages).
(Go To: Top | General Summary | Monthly Report | Weekly Report | Daily Summary | Hourly Summary | Domain Report | Organisation Report | Host Report | Directory Report | File Type Report)
This report lists the activity in each week.
Each unit () represents 10,000 requests for pages or part thereof.
| week beg. | pages | reqs | Gbytes | |
|---|---|---|---|---|
| 29/Jun/08 | 36090 | 70921 | 1.80 | |
| 6/Jul/08 | 268328 | 697283 | 14.64 | |
Busiest week: week beginning 6/Jul/08 (268,328 requests for pages).
(Go To: Top | General Summary | Monthly Report | Weekly Report | Daily Summary | Hourly Summary | Domain Report | Organisation Report | Host Report | Directory Report | File Type Report)
This report lists the total activity for each day of the week, summed over all the weeks in the report.
Each unit () represents 1,500 requests for pages or part thereof.
| day | pages | reqs | Gbytes | |
|---|---|---|---|---|
| Sun | 40078 | 93295 | 2.60 | |
| Mon | 44520 | 107470 | 2.84 | |
| Tue | 35457 | 99274 | 2.56 | |
| Wed | 50864 | 148304 | 2.44 |  |
| Thu | 46696 | 126953 | 2.03 | |
| Fri | 45180 | 110592 | 1.96 | |
| Sat | 41623 | 82316 | 2.01 | |
(Go To: Top | General Summary | Monthly Report | Weekly Report | Daily Summary | Hourly Summary | Domain Report | Organisation Report | Host Report | Directory Report | File Type Report)
This report lists the total activity for each hour of the day, summed over all the days in the report.
Each unit () represents 400 requests for pages or part thereof.
| hour | pages | reqs | Mbytes | |
|---|---|---|---|---|
| 0 | 12556 | 34277 | 746.25 | |
| 1 | 12176 | 28690 | 587.05 | |
| 2 | 12583 | 25397 | 542.66 | |
| 3 | 12508 | 22462 | 526.30 | |
| 4 | 12880 | 23261 | 488.69 | |
| 5 | 13196 | 23853 | 634.04 | |
| 6 | 13018 | 20794 | 517.63 | |
| 7 | 12279 | 25044 | 616.40 | |
| 8 | 12030 | 27091 | 608.03 | |
| 9 | 12959 | 32363 | 611.20 | |
| 10 | 12730 | 37066 | 724.69 | |
| 11 | 13812 | 40710 | 747.01 | |
| 12 | 14550 | 42138 | 806.89 | |
| 13 | 13501 | 35970 | 737.33 | |
| 14 | 12412 | 32997 | 637.60 | |
| 15 | 12174 | 33271 | 722.98 | |
| 16 | 12451 | 36064 | 866.28 | |
| 17 | 12083 | 31627 | 739.33 | |
| 18 | 11813 | 29853 | 958.36 | |
| 19 | 12716 | 31168 | 705.62 | |
| 20 | 11926 | 36273 | 798.42 | |
| 21 | 12719 | 36025 | 943.38 | |
| 22 | 12587 | 39740 | 763.46 | |
| 23 | 12759 | 42070 | 812.28 | |
(Go To: Top | General Summary | Monthly Report | Weekly Report | Daily Summary | Hourly Summary | Domain Report | Organisation Report | Host Report | Directory Report | File Type Report)
This report lists the countries of the computers which requested files.
Listing domains, sorted by the amount of traffic.
| pages | %pages | reqs | %reqs | Gbytes | %bytes | domain |
|---|---|---|---|---|---|---|
| 304418 | 100% | 768204 | 100% | 16.45 | 100% | [unresolved numerical addresses] |
(Go To: Top | General Summary | Monthly Report | Weekly Report | Daily Summary | Hourly Summary | Domain Report | Organisation Report | Host Report | Directory Report | File Type Report)
This report lists the organisations of the computers which requested files.
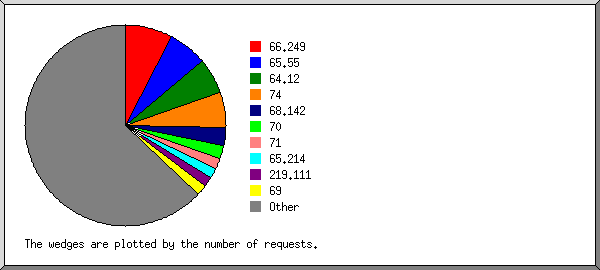
Listing the top 20 organisations by the number of requests, sorted by the number of requests.
| pages | %pages | reqs | %reqs | Gbytes | %bytes | organisation |
|---|---|---|---|---|---|---|
| 66812 | 21.95% | 93221 | 12.13% | 0.24 | 1.48% | 66.249 |
| 80588 | 26.47% | 82518 | 10.74% | 0.28 | 1.68% | 74 |
| 49546 | 16.28% | 49861 | 6.49% | 0.15 | 0.92% | 67.195 |
| 39186 | 12.87% | 46366 | 6.04% | 0.94 | 5.72% | 65.55 |
| 10 | 19388 | 2.52% | 1.18 | 7.18% | 64.12 | |
| 6235 | 2.05% | 17847 | 2.32% | 5.01 | 30.47% | 61.247 |
| 1681 | 0.55% | 16635 | 2.17% | 0.11 | 0.70% | 58 |
| 4442 | 1.46% | 14235 | 1.85% | 0.17 | 1.03% | 119 |
| 1475 | 0.48% | 13204 | 1.72% | 0.13 | 0.77% | 124 |
| 1278 | 0.42% | 11932 | 1.55% | 0.11 | 0.65% | 125 |
| 219 | 0.07% | 11764 | 1.53% | 0.02 | 0.13% | 61.135 |
| 1242 | 0.41% | 11326 | 1.47% | 0.11 | 0.67% | 122 |
| 1034 | 0.34% | 11062 | 1.44% | 0.13 | 0.81% | 121 |
| 4730 | 1.55% | 11016 | 1.43% | 0.06 | 0.36% | 77 |
| 0 | 10929 | 1.42% | 1.06 | 6.43% | 68.142 | |
| 173 | 0.06% | 10048 | 1.31% | 0.02 | 0.11% | 220.181 |
| 815 | 0.27% | 9359 | 1.22% | 0.09 | 0.53% | 118 |
| 704 | 0.23% | 8081 | 1.05% | 0.08 | 0.50% | 59 |
| 834 | 0.27% | 7835 | 1.02% | 0.07 | 0.41% | 60 |
| 816 | 0.27% | 7761 | 1.01% | 0.04 | 0.25% | 71 |
| 42598 | 13.99% | 303816 | 39.55% | 6.45 | 39.20% | [not listed: 2,283 organisations] |
(Go To: Top | General Summary | Monthly Report | Weekly Report | Daily Summary | Hourly Summary | Domain Report | Organisation Report | Host Report | Directory Report | File Type Report)
This report lists the computers which requested files.
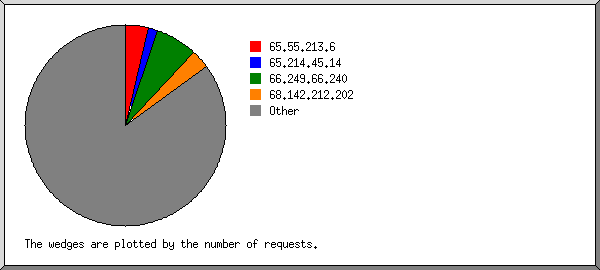
Listing hosts with at least 1000 requests, sorted alphabetically.
| pages | %pages | reqs | %reqs | Gbytes | %bytes | host |
|---|---|---|---|---|---|---|
| 181 | 0.06% | 3034 | 0.39% | 0.02 | 0.09% | 12.223.27.2 |
| 320 | 0.11% | 2985 | 0.39% | 0.02 | 0.10% | 58.69.68.134 |
| 295 | 0.10% | 3253 | 0.42% | 0.02 | 0.11% | 58.69.94.31 |
| 62 | 0.02% | 1044 | 0.14% | 0.00 | 0.02% | 58.69.193.92 |
| 0 | 11543 | 1.50% | 0.02 | 0.12% | 61.135.162.6 | |
| 1190 | 0.39% | 3507 | 0.46% | 1.02 | 6.19% | 61.247.222.52 |
| 1263 | 0.41% | 3615 | 0.47% | 1.02 | 6.21% | 61.247.222.53 |
| 1205 | 0.40% | 3457 | 0.45% | 1.02 | 6.20% | 61.247.222.54 |
| 1292 | 0.42% | 3631 | 0.47% | 1.01 | 6.16% | 61.247.222.55 |
| 1189 | 0.39% | 3326 | 0.43% | 0.94 | 5.71% | 61.247.222.56 |
| 0 | 1466 | 0.19% | 0.09 | 0.54% | 64.12.186.229 | |
| 0 | 2870 | 0.37% | 0.18 | 1.06% | 64.12.186.231 | |
| 0 | 2372 | 0.31% | 0.14 | 0.88% | 64.12.186.232 | |
| 0 | 2161 | 0.28% | 0.13 | 0.80% | 64.12.186.233 | |
| 0 | 2779 | 0.36% | 0.17 | 1.03% | 64.12.186.234 | |
| 0 | 2796 | 0.36% | 0.17 | 1.04% | 64.12.186.235 | |
| 0 | 2669 | 0.35% | 0.16 | 0.99% | 64.12.186.238 | |
| 0 | 1535 | 0.20% | 0.09 | 0.57% | 64.12.186.239 | |
| 2034 | 0.67% | 2041 | 0.27% | 0.00 | 0.01% | 65.55.210.200 |
| 1765 | 0.58% | 1776 | 0.23% | 0.00 | 0.01% | 65.55.210.201 |
| 1739 | 0.57% | 1747 | 0.23% | 0.00 | 0.01% | 65.55.210.202 |
| 1782 | 0.59% | 1791 | 0.23% | 0.00 | 0.01% | 65.55.210.203 |
| 1669 | 0.55% | 1678 | 0.22% | 0.00 | 0.01% | 65.55.210.204 |
| 1613 | 0.53% | 1627 | 0.21% | 0.00 | 0.01% | 65.55.210.205 |
| 1442 | 0.47% | 1452 | 0.19% | 0.00 | 0.01% | 65.55.210.206 |
| 1796 | 0.59% | 1807 | 0.24% | 0.00 | 0.01% | 65.55.210.207 |
| 1647 | 0.54% | 1659 | 0.22% | 0.00 | 0.01% | 65.55.210.208 |
| 1427 | 0.47% | 1434 | 0.19% | 0.00 | 0.01% | 65.55.210.209 |
| 1731 | 0.57% | 1740 | 0.23% | 0.00 | 0.01% | 65.55.210.210 |
| 1449 | 0.48% | 1459 | 0.19% | 0.00 | 0.01% | 65.55.210.211 |
| 3820 | 1.25% | 3836 | 0.50% | 0.00 | 0.02% | 65.55.210.212 |
| 3759 | 1.23% | 3771 | 0.49% | 0.00 | 0.02% | 65.55.210.213 |
| 3035 | 1.00% | 3052 | 0.40% | 0.00 | 0.02% | 65.55.210.214 |
| 896 | 0.29% | 1464 | 0.19% | 0.06 | 0.37% | 65.55.212.19 |
| 4409 | 1.45% | 6158 | 0.80% | 0.22 | 1.31% | 65.55.213.5 |
| 1203 | 0.40% | 1218 | 0.16% | 0.00 | 0.02% | 65.55.230.230 |
| 93 | 0.03% | 2044 | 0.27% | 0.01 | 0.05% | 65.214.44.28 |
| 2051 | 0.67% | 2064 | 0.27% | 0.01 | 0.06% | 65.214.45.119 |
| 58078 | 19.08% | 80506 | 10.48% | 0.20 | 1.23% | 66.249.67.205 |
| 8150 | 2.68% | 10531 | 1.37% | 0.02 | 0.13% | 66.249.73.84 |
| 17427 | 5.72% | 17621 | 2.29% | 0.05 | 0.33% | 67.195.37.153 |
| 0 | 10929 | 1.42% | 1.06 | 6.43% | 68.142.212.217 | |
| 571 | 0.19% | 4854 | 0.63% | 0.02 | 0.14% | 71.76.205.179 |
| 96 | 0.03% | 1130 | 0.15% | 0.01 | 0.04% | 71.227.181.218 |
| 75 | 0.02% | 1139 | 0.15% | 0.01 | 0.03% | 72.21.233.217 |
| 371 | 0.12% | 2036 | 0.27% | 0.29 | 1.73% | 72.30.12.69 |
| 41329 | 13.58% | 41651 | 5.42% | 0.14 | 0.82% | 74.6.17.190 |
| 38600 | 12.68% | 38858 | 5.06% | 0.12 | 0.72% | 74.6.18.226 |
| 2869 | 0.94% | 2874 | 0.37% | 0.00 | 0.02% | 77.88.27.27 |
| 1658 | 0.54% | 6144 | 0.80% | 0.04 | 0.26% | 77.91.224.13 |
| 57 | 0.02% | 1251 | 0.16% | 0.00 | 0.03% | 78.137.163.133 |
| 160 | 0.05% | 1144 | 0.15% | 0.04 | 0.25% | 78.145.141.0 |
| 152 | 0.05% | 1148 | 0.15% | 0.01 | 0.06% | 83.61.165.34 |
| 240 | 0.08% | 2101 | 0.27% | 0.01 | 0.09% | 85.236.138.83 |
| 59 | 0.02% | 1330 | 0.17% | 0.01 | 0.03% | 89.152.38.224 |
| 226 | 0.07% | 3412 | 0.44% | 0.02 | 0.09% | 89.243.88.92 |
| 158 | 0.05% | 1419 | 0.18% | 0.01 | 0.05% | 92.83.119.141 |
| 0 | 3308 | 0.43% | 0.05 | 0.28% | 119.63.193.200 | |
| 0 | 5636 | 0.73% | 0.10 | 0.58% | 119.63.193.201 | |
| 4261 | 1.40% | 4275 | 0.56% | 0.02 | 0.10% | 119.63.194.112 |
| 102 | 0.03% | 1396 | 0.18% | 0.03 | 0.17% | 121.117.2.140 |
| 150 | 0.05% | 1567 | 0.20% | 0.01 | 0.07% | 124.13.7.86 |
| 259 | 0.09% | 1883 | 0.25% | 0.01 | 0.05% | 130.158.19.24 |
| 4053 | 1.33% | 4056 | 0.53% | 0.01 | 0.04% | 133.9.84.95 |
| 364 | 0.12% | 3631 | 0.47% | 0.12 | 0.74% | 133.25.19.153 |
| 110 | 0.04% | 1254 | 0.16% | 0.01 | 0.03% | 142.59.143.195 |
| 126 | 0.04% | 1568 | 0.20% | 0.01 | 0.06% | 189.3.46.38 |
| 284 | 0.09% | 1656 | 0.22% | 0.01 | 0.05% | 192.244.210.205 |
| 83 | 0.03% | 1062 | 0.14% | 0.00 | 0.02% | 194.63.235.180 |
| 284 | 0.09% | 2067 | 0.27% | 0.02 | 0.11% | 195.200.70.22 |
| 293 | 0.10% | 2134 | 0.28% | 0.02 | 0.11% | 195.220.165.24 |
| 465 | 0.15% | 4527 | 0.59% | 0.03 | 0.18% | 202.84.20.21 |
| 1979 | 0.65% | 2005 | 0.26% | 0.00 | 0.01% | 202.93.82.100 |
| 57 | 0.02% | 1014 | 0.13% | 0.00 | 0.02% | 202.185.72.203 |
| 205 | 0.07% | 1206 | 0.16% | 0.01 | 0.05% | 202.248.86.158 |
| 90 | 0.03% | 1157 | 0.15% | 0.00 | 0.03% | 203.87.194.218 |
| 49 | 0.02% | 1002 | 0.13% | 0.00 | 0.02% | 203.215.116.75 |
| 0 | 9867 | 1.28% | 0.02 | 0.10% | 220.181.5.144 | |
| 223 | 0.07% | 2054 | 0.27% | 0.01 | 0.08% | 222.12.157.30 |
| 74348 | 24.42% | 377940 | 49.20% | 7.37 | 44.80% | [not listed: 11,274 hosts] |
(Go To: Top | General Summary | Monthly Report | Weekly Report | Daily Summary | Hourly Summary | Domain Report | Organisation Report | Host Report | Directory Report | File Type Report)
This report lists the directories from which files were requested. (The figures for each directory include all of its subdirectories.)
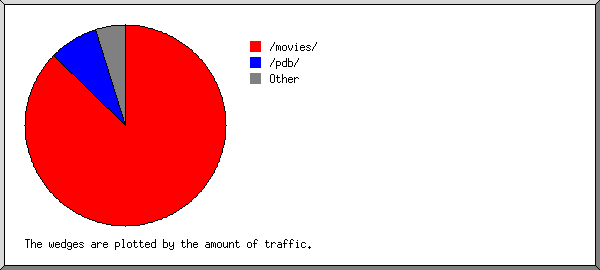
Listing directories with at least 0.01% of the traffic, sorted by the amount of traffic.
| pages | %pages | reqs | %reqs | Gbytes | %bytes | directory |
|---|---|---|---|---|---|---|
| 172060 | 56.52% | 372907 | 48.54% | 7.08 | 43.04% | /pdb/ |
| 17716 | 5.82% | 81708 | 10.64% | 5.81 | 35.31% | /movies/ |
| 9266 | 3.04% | 25296 | 3.29% | 0.60 | 3.66% | /pdb5/ |
| 10343 | 3.40% | 25782 | 3.36% | 0.58 | 3.53% | /pdb6/ |
| 10297 | 3.38% | 28087 | 3.66% | 0.56 | 3.37% | /pdb4/ |
| 16092 | 5.29% | 44217 | 5.76% | 0.38 | 2.29% | /pdb2/ |
| 9171 | 3.01% | 22273 | 2.90% | 0.35 | 2.13% | /pdb7/ |
| 12781 | 4.20% | 32712 | 4.26% | 0.31 | 1.86% | /pdb3/ |
| 5361 | 1.76% | 10560 | 1.37% | 0.18 | 1.10% | /pdb8/ |
| 16190 | 5.32% | 18772 | 2.44% | 0.17 | 1.01% | /taxonomy/ |
| 8300 | 2.73% | 14505 | 1.89% | 0.13 | 0.82% | /asagao/ |
| 2447 | 0.80% | 5429 | 0.71% | 0.07 | 0.41% | /virus/ |
| 1809 | 0.59% | 3277 | 0.43% | 0.06 | 0.36% | /gbif/ |
| 30 | 0.01% | 29238 | 3.81% | 0.05 | 0.28% | /gifs/ |
| 5180 | 1.70% | 8191 | 1.07% | 0.04 | 0.26% | /evolution/ |
| 2388 | 0.78% | 3372 | 0.44% | 0.02 | 0.15% | /protistology/ |
| 1481 | 0.49% | 5463 | 0.71% | 0.01 | 0.09% | [root directory] |
| 13 | 26 | 0.01 | 0.07% | /ftp/ | ||
| 1641 | 0.54% | 1989 | 0.26% | 0.01 | 0.07% | /science_internet/ |
| 1046 | 0.34% | 1064 | 0.14% | 0.01 | 0.07% | /protistinfo/ |
| 2 | 19725 | 2.57% | 0.01 | 0.05% | /stylesheets/ | |
| 21 | 0.01% | 670 | 0.09% | 0.00 | 0.02% | /bgcolors/ |
| 232 | 0.08% | 232 | 0.03% | 0.00 | 0.02% | /servers/ |
| 551 | 0.18% | 12709 | 1.65% | 0.00 | 0.02% | [not listed: 7 directories] |
(Go To: Top | General Summary | Monthly Report | Weekly Report | Daily Summary | Hourly Summary | Domain Report | Organisation Report | Host Report | Directory Report | File Type Report)
This report lists the extensions of files.
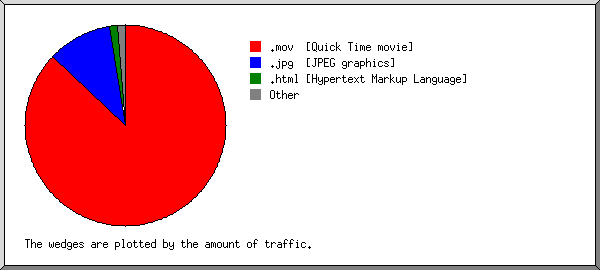
Listing extensions with at least 0.1% of the traffic, sorted by the amount of traffic.
| reqs | %reqs | Gbytes | %bytes | extension |
|---|---|---|---|---|
| 338540 | 44.07% | 9.65 | 58.65% | .jpg [JPEG graphics] |
| 60596 | 7.89% | 5.78 | 35.13% | .mov [Quick Time movie] |
| 241096 | 31.38% | 0.57 | 3.45% | .html [Hypertext Markup Language] |
| 63147 | 8.22% | 0.33 | 2.02% | [directories] |
| 28014 | 3.65% | 0.08 | 0.47% | .gif [GIF graphics] |
| 36811 | 4.79% | 0.05 | 0.28% | [not listed: 68 extensions] |