 Web Server Statistics for [Protist Information Server]
Program started at Mon-14-Apr-2008 18:34.
Analysed requests from Sat-29-Mar-2008 03:20 to Sat-05-Apr-2008 03:20 (7.00 days).
 Web Server Statistics for [Protist Information Server]
Program started at Mon-14-Apr-2008 18:34.
Analysed requests from Sat-29-Mar-2008 03:20 to Sat-05-Apr-2008 03:20 (7.00 days).
(Go To: Top | General Summary | Monthly Report | Weekly Report | Daily Summary | Hourly Summary | Domain Report | Organisation Report | Host Report | Directory Report | File Type Report)
This report contains overall statistics.
Successful requests: 1,121,062
Average successful requests per day: 160,151
Successful requests for pages: 474,965
Average successful requests for pages per day: 67,852
Failed requests: 47,455
Redirected requests: 520
Distinct files requested: 309,453
Distinct hosts served: 13,644
Data transferred: 31.54 gigabytes
Average data transferred per day: 4.51 gigabytes
(Go To: Top | General Summary | Monthly Report | Weekly Report | Daily Summary | Hourly Summary | Domain Report | Organisation Report | Host Report | Directory Report | File Type Report)
This report lists the activity in each month.
Each unit ( ) represents 10,000 requests for pages or part thereof.
| month | pages | reqs | Gbytes | |
|---|---|---|---|---|
| Mar 2008 | 249535 | 553973 | 12.61 |    |
| Apr 2008 | 225430 | 567089 | 18.93 |     |
Busiest month: Mar 2008 (249,535 requests for pages).
(Go To: Top | General Summary | Monthly Report | Weekly Report | Daily Summary | Hourly Summary | Domain Report | Organisation Report | Host Report | Directory Report | File Type Report)
This report lists the activity in each week.
Each unit ( ) represents 20,000 requests for pages or part thereof.
| week beg. | pages | reqs | Gbytes | |
|---|---|---|---|---|
| 23/Mar/08 | 32346 | 69616 | 1.48 |  |
| 30/Mar/08 | 442619 | 1051446 | 30.06 |     |
Busiest week: week beginning 30/Mar/08 (442,619 requests for pages).
(Go To: Top | General Summary | Monthly Report | Weekly Report | Daily Summary | Hourly Summary | Domain Report | Organisation Report | Host Report | Directory Report | File Type Report)
This report lists the total activity for each day of the week, summed over all the weeks in the report.
Each unit ( ) represents 4,000 requests for pages or part thereof.
| day | pages | reqs | Gbytes | |
|---|---|---|---|---|
| Sun | 95623 | 189553 | 3.52 |   |
| Mon | 121566 | 294804 | 7.62 |      |
| Tue | 78185 | 200956 | 9.76 |   |
| Wed | 51409 | 134594 | 4.58 |    |
| Thu | 42216 | 111699 | 2.22 |    |
| Fri | 45645 | 102801 | 2.06 |   |
| Sat | 40321 | 86655 | 1.78 |    |
(Go To: Top | General Summary | Monthly Report | Weekly Report | Daily Summary | Hourly Summary | Domain Report | Organisation Report | Host Report | Directory Report | File Type Report)
This report lists the total activity for each hour of the day, summed over all the days in the report.
Each unit ( ) represents 800 requests for pages or part thereof.
| hour | pages | reqs | Gbytes | |
|---|---|---|---|---|
| 0 | 15141 | 44371 | 1.39 |    |
| 1 | 16682 | 38900 | 1.26 |    |
| 2 | 17211 | 36552 | 1.16 |    |
| 3 | 19870 | 42488 | 1.13 |    |
| 4 | 23642 | 48366 | 1.35 |     |
| 5 | 24587 | 51999 | 1.46 |      |
| 6 | 27531 | 57225 | 1.37 |    |
| 7 | 21111 | 50459 | 1.25 |     |
| 8 | 21514 | 44588 | 1.07 |     |
| 9 | 20669 | 46888 | 1.20 |    |
| 10 | 17730 | 44708 | 1.21 |     |
| 11 | 16872 | 41061 | 1.30 |    |
| 12 | 17783 | 43217 | 1.35 |     |
| 13 | 16921 | 39993 | 1.29 |    |
| 14 | 15069 | 36170 | 1.38 |    |
| 15 | 15908 | 40465 | 1.29 |   |
| 16 | 27812 | 62697 | 1.47 |    |
| 17 | 26902 | 65828 | 1.50 |   |
| 18 | 26899 | 62975 | 1.46 |   |
| 19 | 19076 | 46404 | 1.32 |   |
| 20 | 16424 | 44328 | 1.27 |    |
| 21 | 16863 | 40976 | 1.32 |    |
| 22 | 16341 | 47317 | 1.44 |    |
| 23 | 16407 | 43087 | 1.32 |    |
(Go To: Top | General Summary | Monthly Report | Weekly Report | Daily Summary | Hourly Summary | Domain Report | Organisation Report | Host Report | Directory Report | File Type Report)
This report lists the countries of the computers which requested files.
Listing domains, sorted by the amount of traffic.
| pages | %pages | reqs | %reqs | Gbytes | %bytes | domain |
|---|---|---|---|---|---|---|
| 474965 | 100% | 1121062 | 100% | 31.54 | 100% | [unresolved numerical addresses] |
(Go To: Top | General Summary | Monthly Report | Weekly Report | Daily Summary | Hourly Summary | Domain Report | Organisation Report | Host Report | Directory Report | File Type Report)
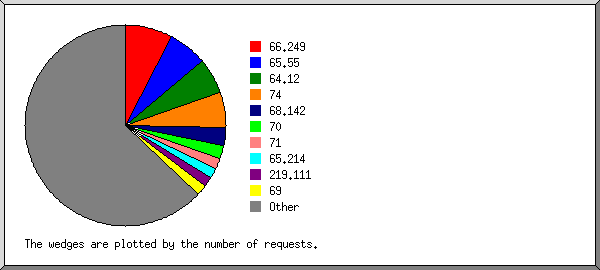
This report lists the organisations of the computers which requested files.

Listing the top 20 organisations by the number of requests, sorted by the number of requests.
| pages | %pages | reqs | %reqs | Gbytes | %bytes | organisation |
|---|---|---|---|---|---|---|
| 176591 | 37.18% | 391012 | 34.88% | 16.99 | 53.88% | 81.214 |
| 107205 | 22.57% | 110925 | 9.89% | 0.19 | 0.61% | 74 |
| 58422 | 12.30% | 71651 | 6.39% | 0.78 | 2.48% | 66.249 |
| 29181 | 6.14% | 32139 | 2.87% | 0.11 | 0.36% | 67.195 |
| 13367 | 2.81% | 28464 | 2.54% | 6.83 | 21.66% | 61.247 |
| 45 | 0.01% | 27698 | 2.47% | 1.68 | 5.33% | 64.12 |
| 20809 | 4.38% | 21449 | 1.91% | 0.06 | 0.19% | 217.212 |
| 17167 | 3.61% | 18500 | 1.65% | 0.15 | 0.47% | 65.55 |
| 5591 | 1.18% | 13894 | 1.24% | 0.15 | 0.49% | 122 |
| 1051 | 0.22% | 13354 | 1.19% | 0.13 | 0.40% | 125 |
| 172 | 0.04% | 11795 | 1.05% | 0.00 | 0.01% | 220.181 |
| 0 | 11619 | 1.04% | 0.00 | 0.01% | 202.108 | |
| 5919 | 1.25% | 9060 | 0.81% | 0.10 | 0.30% | 65.214 |
| 2241 | 0.47% | 8091 | 0.72% | 0.05 | 0.16% | 72 |
| 619 | 0.13% | 7525 | 0.67% | 0.09 | 0.29% | 124 |
| 530 | 0.11% | 7505 | 0.67% | 0.08 | 0.26% | 59 |
| 420 | 0.09% | 7157 | 0.64% | 0.04 | 0.12% | 71 |
| 378 | 0.08% | 6013 | 0.54% | 0.07 | 0.22% | 121 |
| 497 | 0.10% | 5648 | 0.50% | 0.06 | 0.19% | 84 |
| 496 | 0.10% | 5242 | 0.47% | 0.03 | 0.10% | 76 |
| 34264 | 7.21% | 312321 | 27.86% | 3.93 | 12.47% | [not listed: 3,117 organisations] |
(Go To: Top | General Summary | Monthly Report | Weekly Report | Daily Summary | Hourly Summary | Domain Report | Organisation Report | Host Report | Directory Report | File Type Report)
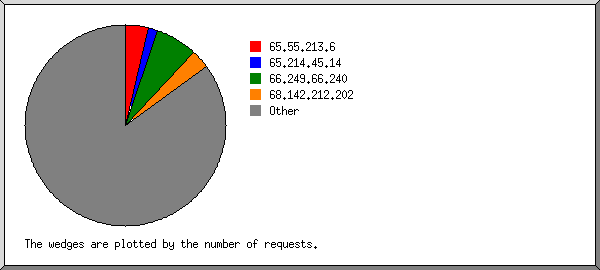
This report lists the computers which requested files.

Listing hosts with at least 1000 requests, sorted alphabetically.
| pages | %pages | reqs | %reqs | Gbytes | %bytes | host |
|---|---|---|---|---|---|---|
| 121 | 0.03% | 2246 | 0.20% | 0.03 | 0.09% | 59.141.241.39 |
| 338 | 0.07% | 4259 | 0.38% | 0.05 | 0.15% | 61.79.64.73 |
| 125 | 0.03% | 1133 | 0.10% | 0.03 | 0.09% | 61.210.248.247 |
| 114 | 0.02% | 1038 | 0.09% | 0.01 | 0.02% | 61.213.252.20 |
| 1090 | 0.23% | 2264 | 0.20% | 0.54 | 1.73% | 61.247.217.33 |
| 1170 | 0.25% | 2470 | 0.22% | 0.61 | 1.95% | 61.247.217.34 |
| 946 | 0.20% | 2017 | 0.18% | 0.48 | 1.52% | 61.247.217.35 |
| 1141 | 0.24% | 2422 | 0.22% | 0.60 | 1.90% | 61.247.217.36 |
| 1176 | 0.25% | 2446 | 0.22% | 0.59 | 1.86% | 61.247.217.37 |
| 1197 | 0.25% | 2481 | 0.22% | 0.59 | 1.88% | 61.247.217.38 |
| 1073 | 0.23% | 2387 | 0.21% | 0.61 | 1.94% | 61.247.217.39 |
| 1209 | 0.25% | 2529 | 0.23% | 0.60 | 1.91% | 61.247.217.40 |
| 1020 | 0.21% | 2176 | 0.19% | 0.54 | 1.70% | 61.247.217.41 |
| 1232 | 0.26% | 2484 | 0.22% | 0.57 | 1.80% | 61.247.217.42 |
| 879 | 0.19% | 1960 | 0.17% | 0.50 | 1.60% | 61.247.217.43 |
| 1120 | 0.24% | 2457 | 0.22% | 0.59 | 1.87% | 61.247.217.44 |
| 1 | 2334 | 0.21% | 0.14 | 0.45% | 64.12.186.229 | |
| 0 | 3307 | 0.29% | 0.20 | 0.64% | 64.12.186.231 | |
| 0 | 2575 | 0.23% | 0.16 | 0.50% | 64.12.186.232 | |
| 0 | 3026 | 0.27% | 0.18 | 0.59% | 64.12.186.233 | |
| 0 | 3410 | 0.30% | 0.21 | 0.66% | 64.12.186.234 | |
| 0 | 3308 | 0.30% | 0.20 | 0.64% | 64.12.186.235 | |
| 0 | 2861 | 0.26% | 0.17 | 0.55% | 64.12.186.237 | |
| 0 | 3120 | 0.28% | 0.19 | 0.60% | 64.12.186.238 | |
| 0 | 2951 | 0.26% | 0.18 | 0.57% | 64.12.186.239 | |
| 1510 | 0.32% | 1521 | 0.14% | 0.00 | 65.55.209.169 | |
| 1713 | 0.36% | 1728 | 0.15% | 0.00 | 65.55.209.170 | |
| 1856 | 0.39% | 1874 | 0.17% | 0.00 | 65.55.209.171 | |
| 2036 | 0.43% | 2050 | 0.18% | 0.00 | 65.55.209.172 | |
| 1647 | 0.35% | 1666 | 0.15% | 0.00 | 65.55.209.173 | |
| 2900 | 0.61% | 2915 | 0.26% | 0.00 | 0.01% | 65.55.209.174 |
| 1494 | 0.31% | 1508 | 0.13% | 0.00 | 65.55.209.175 | |
| 1726 | 0.36% | 2266 | 0.20% | 0.04 | 0.13% | 65.55.213.15 |
| 82 | 0.02% | 1901 | 0.17% | 0.01 | 0.02% | 65.214.44.29 |
| 0 | 1296 | 0.12% | 0.06 | 0.21% | 65.214.45.100 | |
| 5782 | 1.22% | 5795 | 0.52% | 0.02 | 0.07% | 65.214.45.119 |
| 2067 | 0.44% | 2076 | 0.19% | 0.01 | 0.04% | 66.249.67.140 |
| 39580 | 8.33% | 51876 | 4.63% | 0.55 | 1.76% | 66.249.73.18 |
| 3948 | 0.83% | 3964 | 0.35% | 0.02 | 0.06% | 66.249.73.180 |
| 11104 | 2.34% | 11183 | 1.00% | 0.14 | 0.43% | 66.249.73.207 |
| 1650 | 0.35% | 1681 | 0.15% | 0.05 | 0.16% | 66.249.73.242 |
| 146 | 0.03% | 2640 | 0.24% | 0.01 | 0.03% | 67.33.232.75 |
| 3518 | 0.74% | 3523 | 0.31% | 0.01 | 0.02% | 67.110.143.38 |
| 910 | 0.19% | 1153 | 0.10% | 0.00 | 0.01% | 67.195.37.92 |
| 952 | 0.20% | 1059 | 0.09% | 0.01 | 0.02% | 67.195.37.93 |
| 9045 | 1.90% | 11613 | 1.04% | 0.03 | 0.11% | 67.195.37.119 |
| 235 | 0.05% | 1475 | 0.13% | 0.02 | 0.07% | 72.14.193.163 |
| 59 | 0.01% | 1307 | 0.12% | 0.00 | 0.02% | 78.137.163.133 |
| 108 | 0.02% | 1447 | 0.13% | 0.01 | 0.02% | 80.251.37.194 |
| 176590 | 37.18% | 391008 | 34.88% | 16.99 | 53.88% | 81.214.226.115 |
| 103 | 0.02% | 1381 | 0.12% | 0.01 | 0.02% | 83.181.183.127 |
| 235 | 0.05% | 3059 | 0.27% | 0.01 | 0.05% | 84.3.155.73 |
| 243 | 0.05% | 2169 | 0.19% | 0.01 | 0.05% | 87.97.87.182 |
| 182 | 0.04% | 1098 | 0.10% | 0.03 | 0.11% | 88.166.141.70 |
| 77 | 0.02% | 1106 | 0.10% | 0.00 | 0.01% | 92.43.185.83 |
| 5077 | 1.07% | 5085 | 0.45% | 0.02 | 0.06% | 122.152.128.22 |
| 0 | 2909 | 0.26% | 0.05 | 0.16% | 122.152.140.5 | |
| 54 | 0.01% | 1051 | 0.09% | 0.00 | 0.01% | 125.162.89.76 |
| 74 | 0.02% | 1217 | 0.11% | 0.02 | 0.07% | 125.174.217.135 |
| 258 | 0.05% | 3192 | 0.28% | 0.05 | 0.17% | 133.25.19.153 |
| 81 | 0.02% | 1127 | 0.10% | 0.00 | 0.01% | 160.80.56.43 |
| 192 | 0.04% | 1302 | 0.12% | 0.02 | 0.05% | 200.233.31.248 |
| 0 | 11619 | 1.04% | 0.00 | 0.01% | 202.108.23.56 | |
| 187 | 0.04% | 3505 | 0.31% | 0.01 | 0.03% | 206.180.109.22 |
| 66 | 0.01% | 1110 | 0.10% | 0.01 | 0.02% | 207.70.191.74 |
| 541 | 0.11% | 1145 | 0.10% | 0.00 | 208.111.154.15 | |
| 818 | 0.17% | 1706 | 0.15% | 0.00 | 0.01% | 208.111.154.16 |
| 1350 | 0.28% | 1351 | 0.12% | 0.01 | 0.03% | 210.165.9.96 |
| 173 | 0.04% | 4283 | 0.38% | 0.06 | 0.18% | 211.1.219.168 |
| 378 | 0.08% | 3145 | 0.28% | 0.02 | 0.06% | 216.79.193.56 |
| 1523 | 0.32% | 1551 | 0.14% | 0.00 | 0.02% | 217.212.224.144 |
| 2019 | 0.43% | 2045 | 0.18% | 0.01 | 0.02% | 217.212.224.169 |
| 1504 | 0.32% | 1522 | 0.14% | 0.00 | 0.01% | 217.212.224.170 |
| 1451 | 0.31% | 1488 | 0.13% | 0.00 | 0.01% | 217.212.224.177 |
| 1357 | 0.29% | 1378 | 0.12% | 0.00 | 0.01% | 217.212.224.178 |
| 3874 | 0.82% | 3887 | 0.35% | 0.01 | 0.03% | 217.212.224.179 |
| 3867 | 0.81% | 3874 | 0.35% | 0.01 | 0.04% | 217.212.224.181 |
| 0 | 11620 | 1.04% | 0.00 | 0.01% | 220.181.3.54 | |
| 164671 | 34.67% | 466951 | 41.65% | 4.55 | 14.43% | [not listed: 13,566 hosts] |
(Go To: Top | General Summary | Monthly Report | Weekly Report | Daily Summary | Hourly Summary | Domain Report | Organisation Report | Host Report | Directory Report | File Type Report)
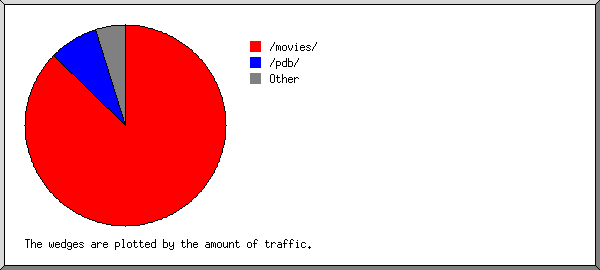
This report lists the directories from which files were requested. (The figures for each directory include all of its subdirectories.)

Listing directories with at least 0.01% of the traffic, sorted by the amount of traffic.
| pages | %pages | reqs | %reqs | Gbytes | %bytes | directory |
|---|---|---|---|---|---|---|
| 310218 | 65.31% | 643556 | 57.41% | 23.10 | 73.24% | /pdb/ |
| 17580 | 3.70% | 89580 | 7.99% | 4.16 | 13.19% | /movies/ |
| 24205 | 5.10% | 66427 | 5.93% | 0.76 | 2.41% | /pdb2/ |
| 16936 | 3.57% | 36946 | 3.30% | 0.69 | 2.19% | /pdb6/ |
| 17405 | 3.66% | 39909 | 3.56% | 0.62 | 1.97% | /pdb4/ |
| 15043 | 3.17% | 36781 | 3.28% | 0.55 | 1.75% | /pdb5/ |
| 16207 | 3.41% | 33536 | 2.99% | 0.48 | 1.51% | /pdb7/ |
| 18429 | 3.88% | 47110 | 4.20% | 0.43 | 1.38% | /pdb3/ |
| 7089 | 1.49% | 13658 | 1.22% | 0.33 | 1.06% | /pdb8/ |
| 12143 | 2.56% | 14453 | 1.29% | 0.13 | 0.40% | /taxonomy/ |
| 8263 | 1.74% | 13996 | 1.25% | 0.09 | 0.29% | /asagao/ |
| 23 | 32184 | 2.87% | 0.05 | 0.15% | /gifs/ | |
| 1871 | 0.39% | 3773 | 0.34% | 0.04 | 0.13% | /virus/ |
| 1780 | 0.37% | 2489 | 0.22% | 0.04 | 0.12% | /gbif/ |
| 2044 | 0.43% | 5287 | 0.47% | 0.02 | 0.06% | [root directory] |
| 1935 | 0.41% | 2230 | 0.20% | 0.01 | 0.03% | /science_internet/ |
| 1864 | 0.39% | 2036 | 0.18% | 0.01 | 0.03% | /protistology/ |
| 0 | 19887 | 1.77% | 0.01 | 0.03% | /stylesheets/ | |
| 1016 | 0.21% | 1034 | 0.09% | 0.01 | 0.02% | /protistinfo/ |
| 16 | 516 | 0.05% | 0.00 | 0.01% | /bgcolors/ | |
| 898 | 0.19% | 15674 | 1.40% | 0.01 | 0.02% | [not listed: 10 directories] |
(Go To: Top | General Summary | Monthly Report | Weekly Report | Daily Summary | Hourly Summary | Domain Report | Organisation Report | Host Report | Directory Report | File Type Report)
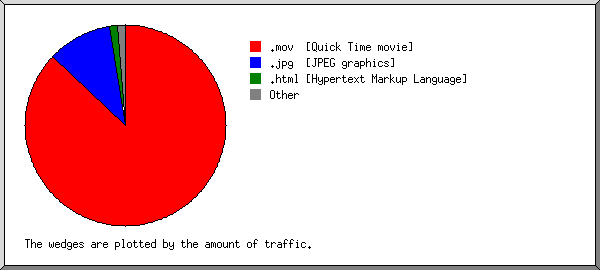
This report lists the extensions of files.

Listing extensions with at least 0.1% of the traffic, sorted by the amount of traffic.
| reqs | %reqs | Gbytes | %bytes | extension |
|---|---|---|---|---|
| 511221 | 45.60% | 26.03 | 82.53% | .jpg [JPEG graphics] |
| 67697 | 6.04% | 4.20 | 13.30% | .mov [Quick Time movie] |
| 392696 | 35.03% | 0.76 | 2.42% | .html [Hypertext Markup Language] |
| 82128 | 7.33% | 0.46 | 1.46% | [directories] |
| 28507 | 2.54% | 0.06 | 0.18% | .gif [GIF graphics] |
| 38813 | 3.46% | 0.04 | 0.11% | [not listed: 71 extensions] |