 Web Server Statistics for [Protist Information Server]
Program started at Thu-18-Oct-2007 22:18.
Analysed requests from Sat-29-Sep-2007 03:20 to Sat-06-Oct-2007 03:20 (7.00 days).
 Web Server Statistics for [Protist Information Server]
Program started at Thu-18-Oct-2007 22:18.
Analysed requests from Sat-29-Sep-2007 03:20 to Sat-06-Oct-2007 03:20 (7.00 days).
(Go To: Top | General Summary | Monthly Report | Weekly Report | Daily Summary | Hourly Summary | Domain Report | Organisation Report | Host Report | Directory Report | File Type Report)
This report contains overall statistics.
Successful requests: 632,665
Average successful requests per day: 90,380
Successful requests for pages: 170,998
Average successful requests for pages per day: 24,428
Failed requests: 12,797
Redirected requests: 337
Distinct files requested: 147,969
Distinct hosts served: 14,133
Data transferred: 11.96 gigabytes
Average data transferred per day: 1.71 gigabytes
(Go To: Top | General Summary | Monthly Report | Weekly Report | Daily Summary | Hourly Summary | Domain Report | Organisation Report | Host Report | Directory Report | File Type Report)
This report lists the activity in each month.
Each unit ( ) represents 5,000 requests for pages or part thereof.
| month | pages | reqs | Gbytes | |
|---|---|---|---|---|
| Sep 2007 | 41277 | 128360 | 2.21 |   |
| Oct 2007 | 129721 | 504305 | 9.75 |    |
Busiest month: Oct 2007 (129,721 requests for pages).
(Go To: Top | General Summary | Monthly Report | Weekly Report | Daily Summary | Hourly Summary | Domain Report | Organisation Report | Host Report | Directory Report | File Type Report)
This report lists the activity in each week.
Each unit ( ) represents 6,000 requests for pages or part thereof.
| week beg. | pages | reqs | Gbytes | |
|---|---|---|---|---|
| 23/Sep/07 | 18488 | 56735 | 1.16 |  |
| 30/Sep/07 | 152510 | 575930 | 10.80 |    |
Busiest week: week beginning 30/Sep/07 (152,510 requests for pages).
(Go To: Top | General Summary | Monthly Report | Weekly Report | Daily Summary | Hourly Summary | Domain Report | Organisation Report | Host Report | Directory Report | File Type Report)
This report lists the total activity for each day of the week, summed over all the weeks in the report.
Each unit ( ) represents 800 requests for pages or part thereof.
| day | pages | reqs | Gbytes | |
|---|---|---|---|---|
| Sun | 22789 | 71625 | 1.05 |     |
| Mon | 24097 | 84201 | 1.11 |      |
| Tue | 24889 | 86883 | 1.68 |  |
| Wed | 25214 | 100369 | 1.97 |  |
| Thu | 23231 | 110453 | 2.61 |     |
| Fri | 28247 | 109143 | 2.11 |   |
| Sat | 22531 | 69991 | 1.42 |     |
(Go To: Top | General Summary | Monthly Report | Weekly Report | Daily Summary | Hourly Summary | Domain Report | Organisation Report | Host Report | Directory Report | File Type Report)
This report lists the total activity for each hour of the day, summed over all the days in the report.
Each unit ( ) represents 250 requests for pages or part thereof.
| hour | pages | reqs | Mbytes | |
|---|---|---|---|---|
| 0 | 7179 | 28548 | 633.29 |     |
| 1 | 6815 | 26561 | 456.40 |    |
| 2 | 7128 | 26630 | 424.41 |     |
| 3 | 6845 | 26940 | 478.05 |    |
| 4 | 6691 | 34007 | 421.53 |     |
| 5 | 6495 | 23366 | 461.21 |    |
| 6 | 6240 | 21799 | 341.62 |    |
| 7 | 6177 | 20943 | 445.78 |    |
| 8 | 6388 | 21562 | 493.54 |    |
| 9 | 6120 | 22333 | 351.79 |    |
| 10 | 6455 | 25779 | 364.57 |    |
| 11 | 6703 | 28190 | 386.20 |     |
| 12 | 6706 | 24358 | 431.93 |     |
| 13 | 6921 | 24622 | 417.02 |    |
| 14 | 7007 | 26530 | 466.29 |     |
| 15 | 7406 | 25832 | 412.68 |     |
| 16 | 7918 | 26491 | 457.71 |  |
| 17 | 8409 | 27644 | 609.71 |   |
| 18 | 8671 | 28779 | 782.36 |    |
| 19 | 7930 | 24510 | 667.44 |  |
| 20 | 7780 | 26672 | 598.29 |  |
| 21 | 7842 | 30029 | 730.97 |  |
| 22 | 8042 | 30914 | 676.71 |   |
| 23 | 7130 | 29626 | 733.84 |     |
(Go To: Top | General Summary | Monthly Report | Weekly Report | Daily Summary | Hourly Summary | Domain Report | Organisation Report | Host Report | Directory Report | File Type Report)
This report lists the countries of the computers which requested files.
Listing domains, sorted by the amount of traffic.
| pages | %pages | reqs | %reqs | Gbytes | %bytes | domain |
|---|---|---|---|---|---|---|
| 170998 | 100% | 632665 | 100% | 11.96 | 100% | [unresolved numerical addresses] |
(Go To: Top | General Summary | Monthly Report | Weekly Report | Daily Summary | Hourly Summary | Domain Report | Organisation Report | Host Report | Directory Report | File Type Report)
This report lists the organisations of the computers which requested files.

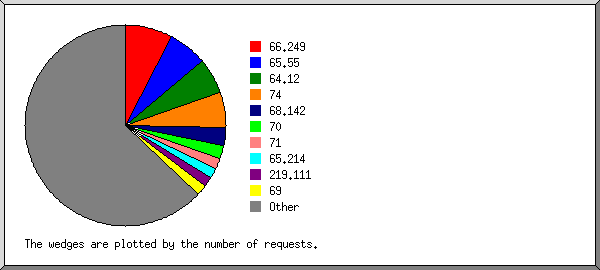
Listing the top 20 organisations by the number of requests, sorted by the number of requests.
| pages | %pages | reqs | %reqs | Gbytes | %bytes | organisation |
|---|---|---|---|---|---|---|
| 53810 | 31.47% | 60071 | 9.49% | 0.45 | 3.77% | 74 |
| 12898 | 7.54% | 33825 | 5.35% | 0.51 | 4.23% | 66.249 |
| 85 | 0.05% | 22550 | 3.56% | 1.34 | 11.21% | 64.12 |
| 6240 | 3.65% | 16361 | 2.59% | 0.10 | 0.81% | 122 |
| 13039 | 7.63% | 15739 | 2.49% | 0.28 | 2.34% | 65.55 |
| 1167 | 0.68% | 15026 | 2.38% | 0.13 | 1.13% | 125 |
| 8448 | 4.94% | 10863 | 1.72% | 0.28 | 2.35% | 217.212 |
| 3909 | 2.29% | 10648 | 1.68% | 0.07 | 0.61% | 157.82 |
| 562 | 0.33% | 10007 | 1.58% | 2.74 | 22.95% | 69 |
| 766 | 0.45% | 9083 | 1.44% | 0.05 | 0.42% | 204.221 |
| 800 | 0.47% | 8835 | 1.40% | 0.07 | 0.57% | 71 |
| 0 | 8323 | 1.32% | 0.00 | 68.142 | ||
| 8310 | 4.86% | 8319 | 1.31% | 0.02 | 0.16% | 208.36 |
| 757 | 0.44% | 7347 | 1.16% | 0.13 | 1.05% | 124 |
| 680 | 0.40% | 7166 | 1.13% | 0.09 | 0.72% | 60 |
| 1423 | 0.83% | 6959 | 1.10% | 0.05 | 0.40% | 72 |
| 5175 | 3.03% | 6221 | 0.98% | 0.01 | 0.10% | 133.9 |
| 469 | 0.27% | 6104 | 0.96% | 0.06 | 0.53% | 58 |
| 4160 | 2.43% | 5885 | 0.93% | 0.03 | 0.22% | 65.214 |
| 429 | 0.25% | 5394 | 0.85% | 0.03 | 0.28% | 70 |
| 47871 | 28.00% | 357939 | 56.58% | 5.52 | 46.16% | [not listed: 3,278 organisations] |
(Go To: Top | General Summary | Monthly Report | Weekly Report | Daily Summary | Hourly Summary | Domain Report | Organisation Report | Host Report | Directory Report | File Type Report)
This report lists the computers which requested files.

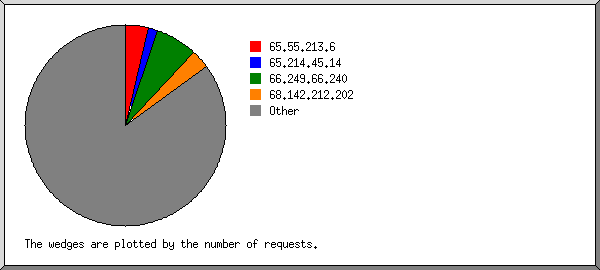
Listing hosts with at least 1000 requests, sorted alphabetically.
| pages | %pages | reqs | %reqs | Gbytes | %bytes | host |
|---|---|---|---|---|---|---|
| 0 | 1647 | 0.26% | 0.10 | 0.84% | 64.12.186.229 | |
| 0 | 2017 | 0.32% | 0.12 | 1.03% | 64.12.186.231 | |
| 0 | 1346 | 0.21% | 0.08 | 0.69% | 64.12.186.232 | |
| 0 | 2021 | 0.32% | 0.12 | 1.03% | 64.12.186.233 | |
| 0 | 1471 | 0.23% | 0.09 | 0.75% | 64.12.186.235 | |
| 0 | 1689 | 0.27% | 0.10 | 0.86% | 64.12.186.237 | |
| 0 | 1940 | 0.31% | 0.12 | 0.99% | 64.12.186.238 | |
| 0 | 1958 | 0.31% | 0.12 | 1.00% | 64.12.186.239 | |
| 0 | 2272 | 0.36% | 0.14 | 1.16% | 64.12.186.241 | |
| 0 | 1923 | 0.30% | 0.12 | 0.98% | 64.12.186.242 | |
| 0 | 1654 | 0.26% | 0.10 | 0.84% | 64.12.186.243 | |
| 2367 | 1.38% | 2369 | 0.37% | 0.01 | 0.10% | 64.213.203.147 |
| 1406 | 0.82% | 1435 | 0.23% | 0.00 | 0.03% | 65.55.209.170 |
| 1201 | 0.70% | 1229 | 0.19% | 0.00 | 0.02% | 65.55.209.171 |
| 1385 | 0.81% | 1415 | 0.22% | 0.00 | 0.03% | 65.55.209.172 |
| 1299 | 0.76% | 1329 | 0.21% | 0.00 | 0.02% | 65.55.209.173 |
| 1633 | 0.95% | 1665 | 0.26% | 0.00 | 0.03% | 65.55.209.174 |
| 1299 | 0.76% | 1329 | 0.21% | 0.00 | 0.02% | 65.55.209.175 |
| 2209 | 1.29% | 4224 | 0.67% | 0.23 | 1.91% | 65.55.212.18 |
| 91 | 0.05% | 1792 | 0.28% | 0.01 | 0.06% | 65.214.39.180 |
| 3648 | 2.13% | 3658 | 0.58% | 0.01 | 0.12% | 65.214.45.119 |
| 12864 | 7.52% | 33044 | 5.22% | 0.50 | 4.15% | 66.249.70.18 |
| 0 | 8323 | 1.32% | 0.00 | 68.142.212.202 | ||
| 234 | 0.14% | 1632 | 0.26% | 0.05 | 0.46% | 69.51.109.118 |
| 436 | 0.25% | 2604 | 0.41% | 0.03 | 0.22% | 80.98.76.106 |
| 157 | 0.09% | 2007 | 0.32% | 0.02 | 0.16% | 81.35.140.4 |
| 5371 | 3.14% | 5376 | 0.85% | 0.02 | 0.15% | 122.152.128.22 |
| 0 | 2891 | 0.46% | 0.01 | 0.05% | 122.152.140.5 | |
| 259 | 0.15% | 3425 | 0.54% | 0.02 | 0.20% | 125.55.189.62 |
| 100 | 0.06% | 1173 | 0.19% | 0.01 | 0.06% | 133.6.208.113 |
| 5006 | 2.93% | 5009 | 0.79% | 0.00 | 0.01% | 133.9.238.95 |
| 92 | 0.05% | 1461 | 0.23% | 0.02 | 0.19% | 133.25.19.153 |
| 120 | 0.07% | 1212 | 0.19% | 0.01 | 0.05% | 133.71.131.185 |
| 1392 | 0.81% | 1393 | 0.22% | 0.01 | 0.06% | 140.123.101.145 |
| 99 | 0.06% | 1200 | 0.19% | 0.01 | 0.06% | 143.117.28.107 |
| 172 | 0.10% | 1277 | 0.20% | 0.01 | 0.07% | 157.80.99.211 |
| 3890 | 2.27% | 10527 | 1.66% | 0.07 | 0.60% | 157.82.156.222 |
| 289 | 0.17% | 1813 | 0.29% | 0.01 | 0.09% | 165.93.3.21 |
| 228 | 0.13% | 1492 | 0.24% | 0.01 | 0.10% | 190.1.161.55 |
| 55 | 0.03% | 1179 | 0.19% | 0.00 | 0.04% | 193.95.154.69 |
| 92 | 0.05% | 1188 | 0.19% | 0.01 | 0.10% | 200.181.209.4 |
| 138 | 0.08% | 1277 | 0.20% | 0.01 | 0.10% | 202.65.191.138 |
| 119 | 0.07% | 1405 | 0.22% | 0.03 | 0.26% | 202.140.212.233 |
| 47 | 0.03% | 1104 | 0.17% | 0.01 | 0.05% | 202.162.130.236 |
| 2932 | 1.71% | 3016 | 0.48% | 0.00 | 0.04% | 202.180.34.186 |
| 766 | 0.45% | 9083 | 1.44% | 0.05 | 0.42% | 204.221.193.130 |
| 8309 | 4.86% | 8318 | 1.31% | 0.02 | 0.16% | 208.36.144.7 |
| 4173 | 2.44% | 4180 | 0.66% | 0.00 | 0.03% | 208.68.136.250 |
| 98 | 0.06% | 1333 | 0.21% | 0.01 | 0.05% | 209.114.129.194 |
| 147 | 0.09% | 1785 | 0.28% | 0.01 | 0.08% | 210.155.14.210 |
| 210 | 0.12% | 2704 | 0.43% | 0.01 | 0.09% | 211.122.120.211 |
| 889 | 0.52% | 1010 | 0.16% | 0.00 | 0.03% | 217.212.224.178 |
| 124 | 0.07% | 1530 | 0.24% | 0.01 | 0.05% | 219.101.107.163 |
| 150 | 0.09% | 1314 | 0.21% | 0.01 | 0.08% | 220.175.85.55 |
| 105502 | 61.70% | 465997 | 73.66% | 9.47 | 79.23% | [not listed: 14,079 hosts] |
(Go To: Top | General Summary | Monthly Report | Weekly Report | Daily Summary | Hourly Summary | Domain Report | Organisation Report | Host Report | Directory Report | File Type Report)
This report lists the directories from which files were requested. (The figures for each directory include all of its subdirectories.)

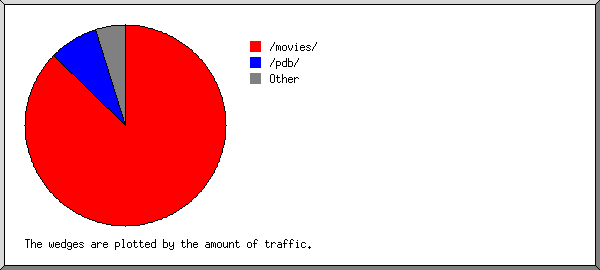
Listing directories with at least 0.01% of the traffic, sorted by the amount of traffic.
| pages | %pages | reqs | %reqs | Gbytes | %bytes | directory |
|---|---|---|---|---|---|---|
| 12384 | 7.24% | 69797 | 11.03% | 7.77 | 64.97% | /movies/ |
| 91434 | 53.47% | 279265 | 44.14% | 2.88 | 24.09% | /pdb/ |
| 10368 | 6.06% | 48020 | 7.59% | 0.19 | 1.57% | /pdb2/ |
| 6198 | 3.62% | 26571 | 4.20% | 0.15 | 1.28% | /pdb6/ |
| 6016 | 3.52% | 24916 | 3.94% | 0.15 | 1.23% | /pdb5/ |
| 7137 | 4.17% | 26998 | 4.27% | 0.14 | 1.18% | /pdb4/ |
| 9001 | 5.26% | 11911 | 1.88% | 0.14 | 1.15% | /taxonomy/ |
| 8453 | 4.94% | 36369 | 5.75% | 0.13 | 1.07% | /pdb3/ |
| 5148 | 3.01% | 11610 | 1.84% | 0.10 | 0.84% | /asagao/ |
| 1910 | 1.12% | 3698 | 0.58% | 0.08 | 0.65% | /gbif/ |
| 4558 | 2.67% | 18022 | 2.85% | 0.07 | 0.57% | /pdb7/ |
| 40 | 0.02% | 37864 | 5.98% | 0.04 | 0.36% | /gifs/ |
| 1957 | 1.14% | 3971 | 0.63% | 0.03 | 0.24% | /virus/ |
| 1539 | 0.90% | 2076 | 0.33% | 0.02 | 0.16% | /protistology/ |
| 868 | 0.51% | 2489 | 0.39% | 0.01 | 0.11% | /pdb8/ |
| 1144 | 0.67% | 1640 | 0.26% | 0.01 | 0.11% | /science_internet/ |
| 1294 | 0.76% | 4559 | 0.72% | 0.01 | 0.10% | [root directory] |
| 658 | 0.38% | 740 | 0.12% | 0.01 | 0.10% | /protistinfo/ |
| 0 | 19585 | 3.10% | 0.01 | 0.07% | /stylesheets/ | |
| 17 | 0.01% | 937 | 0.15% | 0.01 | 0.04% | /bgcolors/ |
| 398 | 0.23% | 678 | 0.11% | 0.00 | 0.04% | /evolution/ |
| 126 | 0.07% | 126 | 0.02% | 0.00 | 0.02% | /servers/ |
| 3 | 10 | 0.00 | 0.02% | /ftp/ | ||
| 347 | 0.20% | 813 | 0.13% | 0.00 | 0.01% | [not listed: 7 directories] |
(Go To: Top | General Summary | Monthly Report | Weekly Report | Daily Summary | Hourly Summary | Domain Report | Organisation Report | Host Report | Directory Report | File Type Report)
This report lists the extensions of files.

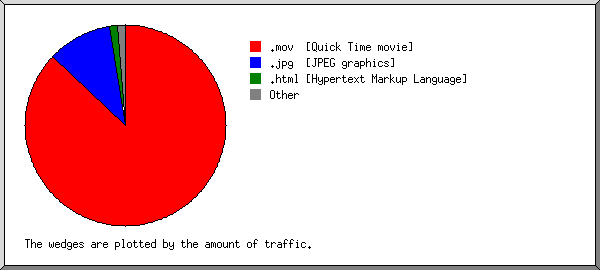
Listing extensions with at least 0.1% of the traffic, sorted by the amount of traffic.
| reqs | %reqs | Gbytes | %bytes | extension |
|---|---|---|---|---|
| 51884 | 8.20% | 7.71 | 64.50% | .mov [Quick Time movie] |
| 351587 | 55.57% | 3.48 | 29.14% | .jpg [JPEG graphics] |
| 126073 | 19.93% | 0.41 | 3.42% | .html [Hypertext Markup Language] |
| 44832 | 7.09% | 0.25 | 2.12% | [directories] |
| 34542 | 5.46% | 0.07 | 0.59% | .gif [GIF graphics] |
| 23747 | 3.75% | 0.03 | 0.25% | [not listed: 63 extensions] |